11 Aug 2026

Performance Under Conflict Conditions: Post-Middle East Conflict Assessment

White Paper

Key Takeaways

  1. Resilient performance, with important nuance. US dollar sukuk delivered strong near term outperformance, while medium term results reflected the interplay of macro forces; the structural investment case, however, remained intact throughout.
  2. Markets separated headlines from fundamentals. The GCC response followed its established geopolitical pattern: initial spread widening on uncertainty, then rapid repricing toward sovereign fundamentals such as reserves, debt to GDP, credit ratings, and oil revenue expectations.
  3. GCC is a diversified, not monolithic, opportunity set. Country level dispersion across credit sectors and sovereigns was significant, underscoring that allocation decisions must account for differences in fiscal structure, hydrocarbon dependence, and sector exposures, as well as the region’s enduring structural pillars and crisis tested diversification benefits.

In the months following the outbreak of conflict in the Middle East in early 2026, investors have closely scrutinized Gulf Cooperation Council (GCC) fixed income markets, with particular attention to US dollar sukuk. Against a backdrop of heightened geopolitical risk and meaningful spread widening, these markets have offered an important real time test of the GCC credit story. The discussion that follows explores how sukuk and broader GCC credit behaved through that stress period and what the episode reveals about the asset class’s structural resilience. It situates that analysis within the market’s longer term growth trajectory: by year end 2025, global sukuk outstanding climbed past the $1 trillion mark for the first time, with US dollar sukuk alone reaching $301.75 billion — a 14.7% year over year increase, well ahead of the three year compound annual growth rate of 11.9%.

Yield Dynamics: An Orderly Market Response

Following the onset of the conflict, fixed income benchmarks behaved in a manner consistent with their underlying credit fundamentals. Lower-rated issuers — US high yield and emerging market hard-currency debt — experienced the most pronounced yield increases as investors demanded greater risk compensation. Investment-grade GCC sovereigns also saw yields rise, but the response was materially more muted and measured.

The Bloomberg GCC Credit USD Total Return Index has historically traded at yields below US investment grade credit. At the height of conflict-driven volatility, GCC spreads temporarily widened by nearly 20-basis-points (bps) above the US investment grade benchmark. By May 1, 2026, the relationship had fully reverted, with GCC Credit trading approximately 1 bps below US investment grade credit (-0.71 bps) — affirming that the dislocation was driven by headline risk rather than fundamental credit deterioration.

Sukuk Performance: Resilient Near-Term, Nuanced Over Time

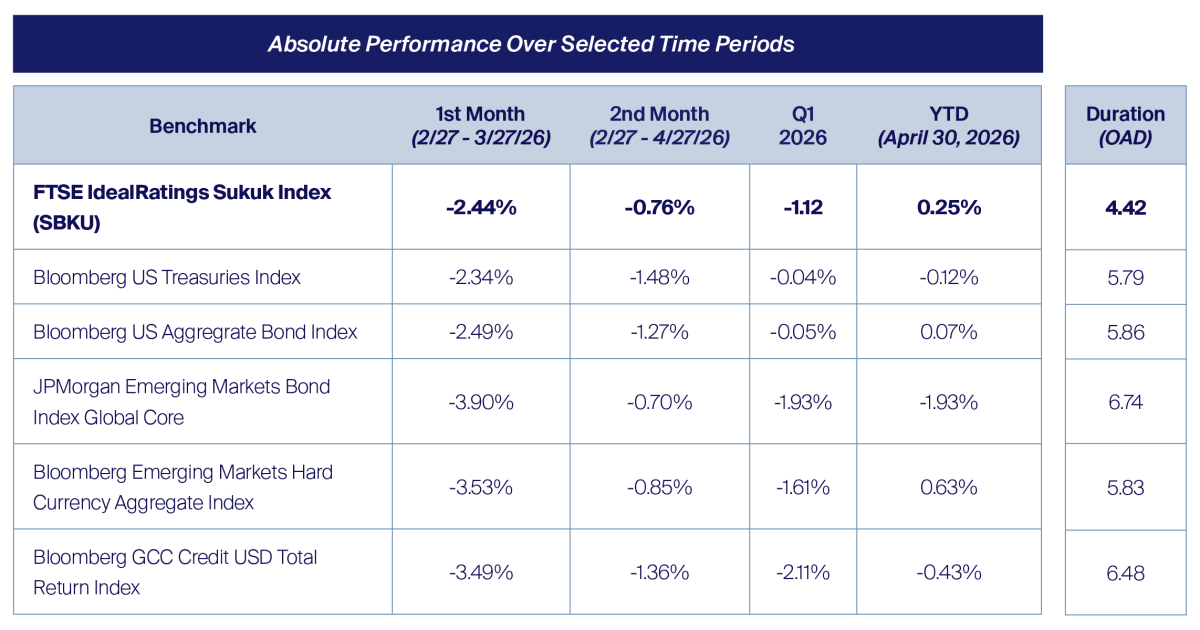
The performance scorecard for US dollar sukuk across measured conflict periods is instructive. In the immediate post-onset period, the original thesis held with conviction; over longer horizons, the interaction of duration positioning, credit spread dynamics, oil-linked fiscal repricing, and geopolitical headlines introduced complexity.

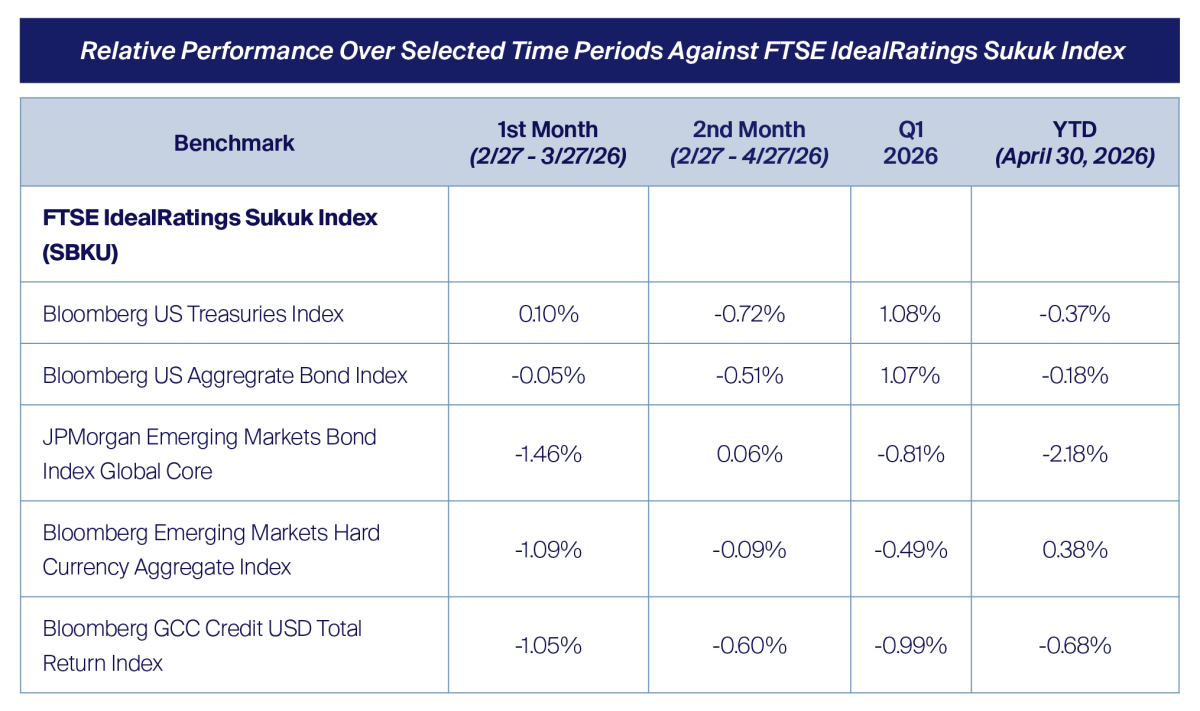
  • Days 1–30: Sukuk outperformed the Bloomberg US Aggregate Bond Index by 5 bps.
  • Days 1–60: Sukuk outperformed the Bloomberg US Aggregate Bond Index by 51 bps.
    • vs. JPMorgan Emerging Markets Bond Index: sukuk outperformed across nearly all periods; one exception was a 6 bps underperformance at the two-month mark.
  • First quarter 2026: Sukuk underperformed the near-flat Bloomberg US Aggregate Bond Index, driven by the confluence of macro forces noted above.
  • Year-to-date through April 2026: Performance metrics began rebalancing toward longer-term structural characteristics as investors had more time to assess economic and geopolitical implications rationally.
Image
Absolute Performance Over Selected Time Periods table

Figure 1: Performance Benchmarks Matrix — 30-Day, 60-Day, Q1 2026 & YTD April 2026
Source: Bloomberg
Image
Relative Performance Over Selected Time Periods Against FTSE IdealRatings Sukuk Index

Source: Bloomberg

Important Disclaimers and Disclosures

Key benchmarks and data sources: Bloomberg US Agg Corporate (LUACYW), Bloomberg GCC USD Credit Index (I21188US), Bloomberg EM Hard Currency (LG20YW), Bloomberg US HY (LF98YW), FTSE IdealRatings Sukuk (SBKU), J.P. Morgan EMBI Global Core (JPEICORE), US Treasury Index (LUATTRUU), WTI Crude Oil (CL1 Comdty).

The Bloomberg US Aggregate Index is a broad-based flagship benchmark that measures the investment grade, US dollar-denominated, fixed-rate taxable bond market. The index includes Treasuries, government-related and corporate securities, MBS (agency fixed-rate pass-throughs), ABS and CMBS (agency and non-agency).

The Bloomberg GCC USD Credit Index family tracks US dollar-denominated fixed-rate bonds and sukuk issued by sovereigns, quasi-sovereigns, and corporations across Gulf Cooperation Council (GCC) countries including Saudi Arabia, the UAE, Qatar, Kuwait, Oman, and Bahrain.

The Bloomberg Emerging Markets Hard Currency Aggregate Index is a flagship hard currency Emerging Markets debt benchmark that includes USD-denominated debt from sovereign, quasi-sovereign, and corporate EM issuers.

The Bloomberg US Treasury Index measures US dollar-denominated, fixed-rate, nominal debt issued by the US Treasury. Treasury bills are excluded by the maturity constraint, but are part of a separate Short Treasury Index. STRIPS are excluded from the index because their inclusion would result in double-counting.

The Bloomberg US Corporate High Yield Bond Index measures the USD-denominated, high-yield, fixed-rate corporate bond market. Securities are classified as high-yield if the middle rating of Moody’s, Fitch, and S&P is Ba1/BB+/BB+ or below.

The FTSE IdealRatings Sukuk measures the performance of global Islamic fixed-income securities, also known as sukuk. Investors cannot invest directly in the Index.

The J.P. Morgan Emerging Market Global Core Index is composed of US dollar-denominated government bonds issued by emerging market countries. The Index is a broad, diverse US dollar-denominated emerging markets debt benchmark that tracks the total return of actively traded external debt instruments in emerging market countries. This includes the Bloomberg Global Credit – United Kingdom Total Return Index Unhedged USD.

This material is for general information only and is not a research report or commentary on any investment products offered by Saturna Capital. This material should not be construed as an offer to sell, or the solicitation of an offer to buy, any security in any jurisdiction where such an offer or solicitation would be illegal. To the extent that it includes references to securities, those references do not constitute a recommendation to buy, sell, or hold such security, and the information may not be current. Accounts managed by Saturna Capital may or may not hold the securities discussed in this material.

We do not provide tax, accounting, or legal advice to our clients, and all investors are advised to consult with their tax, accounting, or legal advisers regarding any potential investment. Investors should not 
assume that investments in the securities and/or sectors described were or will be profitable. This document is prepared based on information Saturna Capital deems reliable; however, Saturna Capital does not warrant the accuracy or completeness of the information. Investors should consult with a financial adviser prior to making an investment decision. The views and information discussed in this commentary are at a specific point in time, are subject to change, and may not reflect the views of the firm as a whole.

All material presented in this publication, unless specifically indicated otherwise, is under copyright to Saturna. No part of this publication may be altered in any way, copied, or distributed without the prior express written permission of Saturna.