Saturna’s Fund Investment Process and Philosophy
Key Takeaways
- Companies that avoid taking on too much debt are less likely to run into serious trouble, like bankruptcy, especially during times of economic disruption.
- Keeping debt low gives businesses more freedom to invest when good opportunities arise and helps them handle unexpected challenges more smoothly.
- While debt has its benefits, too much debt can be risky, and companies with less debt are often more stable and reliable in the long run.
Since our founding more than three decades ago, our Funds have provided competitive returns with lower volatility relative to major market indices — an attractive combination for long-term investors.
The attractions of avoiding excessive debt are straightforward and, one might even say, obvious. It’s difficult to go bankrupt absent excessive debt. In fact, bankruptcy defines a company’s debt as having been excessive. Debt also comes with servicing costs that can change significantly, as we saw with the spike in inflation and interest rates in the wake of the COVID-19 pandemic.
The level and servicing of debt may also limit available funds to exploit investment opportunities. During times of market or economic stress, liquidity can become an important consideration. Companies with lower debt are less likely to find themselves in a liquidity crunch.
In this paper, we’ll examine what drives our philosophy around avoiding excessive debt and how it drives competitive returns with lower volatility relative to major market indices.
Financial Theory Takes an Alternative View
Interestingly, despite the advantages outlined above, modern financial theory would take exception to our focus on minimally leveraged companies. One measure for determining a company’s success in managing its business compares the company’s weighted average cost of capital (WACC) to its return on invested capital (ROIC). In order to achieve an economic profit, a company’s ROIC must exceed its WACC. The “weighted” part of the WACC refers to respective proportions of debt and equity in the capital structure.
According to the theories of Nobel Prize winners Franco Modigliani and Merton Miller, debt is considered less expensive than equity due to the tax shield, or the deductibility of interest payments. Although not included in the theory, debt holders also hold a senior position relative to equity holders in the event of bankruptcy. Of course, equity valuations and individual stock volatility play a role in the relative expense of debt versus equity and, even though interest rates have risen, current US stock market valuations provide debt with a theoretical cost advantage.
Because debt is less expensive, financial theory says that companies can reduce their WACC by increasing the proportion of debt in their capital structure. Like many things, however, there comes a point of diminishing returns. When debt rises to a level that engenders questions regarding the serviceability of the debt, or that hampers a company’s ability to make promising investments due to the burden of interest and debt payments, the reality of increasing risk supplants theory. Where that point lies will vary depending on the stability of a company’s business. Utilities, for example, support higher levels of debt than consumer discretionary companies.
While no single ratio can be applied across the board, we believe our guideline of not investing in companies carrying total debt in excess of 33% of market capitalization provides an ample degree of safety that eliminates the risk of bankruptcy, while ensuring that the company will have the financial resources to act upon attractive investments that may arise.
Modigliani and Miller
Modigliani and Miller’s theory, updated in 1963, states that when a company borrows money (takes on debt), the interest paid on that debt reduces its taxable income because interest is tax-deductible. This “tax shield” allows companies to lower the amount of taxes they pay, which in turn increases the overall value of the business. For each dollar of debt, the company receives a tax benefit equal to the interest paid times the corporate tax rate. Compared to equity, these tax savings make debt a cheaper source of financing, giving firms an incentive to prefer using debt to raise funds.
Screening the Universe
We can wax lyrical regarding the benefits of low debt all day long but absent evidence that constraining our investment universe to low-debt companies adds value, we are not serving our investors’ needs. To support our case, we present the chart below, which tracks the 2015–2024 performance of 700 companies broken into low- and high-debt cohorts defined as those with total debt less than or equal to 33% of market capitalization and those with total debt greater than 33% of market capitalization.
Growth of $10,000
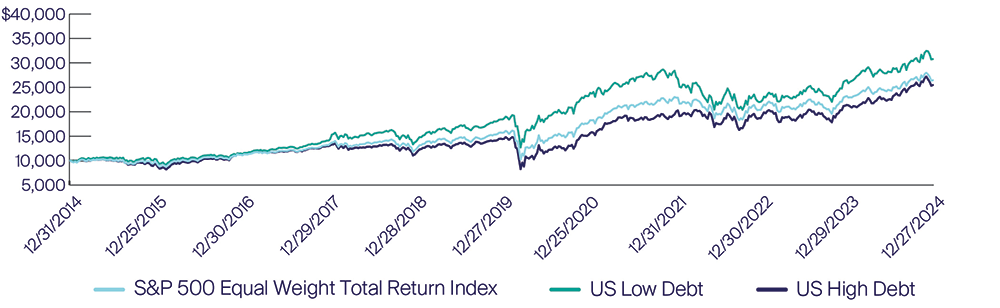
Source: Bloomberg
To create the chart, we have taken the 700 largest US companies by market capitalization, separating by them by the same 33% debt to market capitalization ratio we use in our investments and equal weighting them in the two portfolios. While a company with debt of 34%–35% of market capitalization is not meaningfully more leveraged than one standing at 32%–33%, aggregating debt to market capitalization above and below the 33% marker, we find that median debt for US-based low-debt companies stood at 12% of market capitalization, while the figure for high-debt stocks was 56%. That’s a distinction that does make a difference.
We also note that a solid majority of US companies agree with our appreciation of low debt. Of the 700 companies we reviewed, the pre-pandemic low/high debt ratio was typically 70/30. With higher inflation and interest rates in the pandemic’s wake, companies embarked on a program of balance sheet strengthening such that the 2024 low/high debt spread was the widest seen over the period at 84/16.
The Results Speak for Themselves
As we can see, the low-debt (teal) cohort significantly outperformed with an initial low-debt investment of $10,000 growing to $30,770, against only $25,459 for the high-debt group. The higher low-debt annualized return of 11.90% vs. 9.80% was achieved with lower volatility or “risk” as the annualized standard deviation of returns for the low-debt group was 18.76% versus 20.70% for the more indebted counterparts.
Additionally, the maximum drawdown for the low-debt portfolio was -34.19% versus -44.24% for the high-debt companies. Both maximum drawdowns occurred in March 2020 at the start of the COVID-19 pandemic, demonstrating that in the event of exogenous shocks to the market, low debt can provide a margin of safety.
| Portfolio | Beginning Value | Ending Value | Volatility1 | Max Drawdown |
| Low Debt | $10,000 | $30,770 | 18.76% | -34.19% |
| High Debt | $10,000 | $25,459 | 20.70% | -44.24% |
| S&P 5002 | $10,000 | $25,838 | 18.28% | -36.75% |
1 Defined as annualized standard deviation of returns.
2 Equal-weighted
To be sure, long-term outperformance does not imply day in day out outperformance. From the chart above, we can see that the low-debt portfolio underperformed during the market sell-off in 2022. While contrary to the idea that lower debt levels can provide downside protection during times of market distress, we chalk up the 2022 experience to the sharp sell-off experienced among low debt technology companies that had aggressively appreciated following the market nadir in March 2020.
Nor does debt differential affect every sector to the same degree. For some sectors, such as Consumer Staples, performance of low versus high-debt companies indicates investors are largely indifferent to balance sheet leverage. That may be due to the stable nature of staples demand.
Additionally, low-debt companies benefit from stronger balance sheets, reduced risk and volatility, and superior resilience during economic downturns — advantages that support sustainable growth and value creation for shareholders. In an environment of market uncertainty or rising interest rates, these characteristics allow low-debt stocks to not only weather financial storms but also seize growth opportunities, making them a compelling core of our long-term investment strategy.
Growth of $10,000: Consumer Staples (12/31/2014 - 12/31/2024)
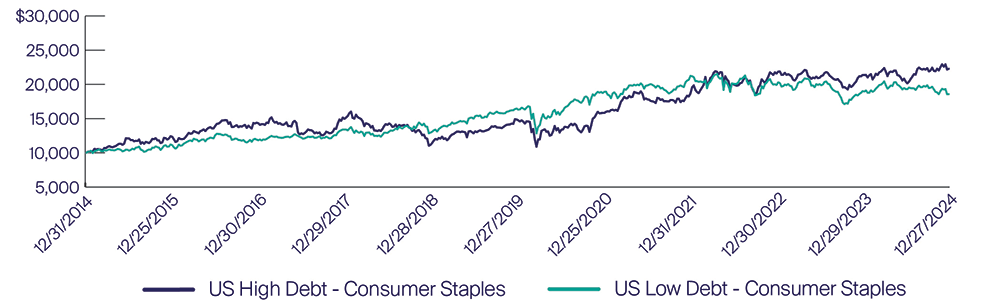
Source: Bloomberg
Growth of $10,000: Health Care (12/31/2014 - 12/31/2024)
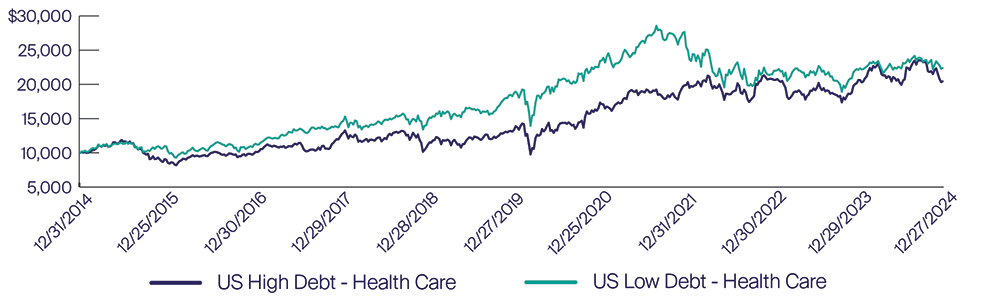
Source: Bloomberg
Investors demonstrated a preference for lower debt healthcare companies in the years leading up to the pandemic and, unsurprisingly during the pandemic when those with available resources were able to rapidly respond to demand for testing, consumables and, of course, vaccines. That was followed by a period of significant underperformance as businesses normalized once the pandemic had passed.
Technology company performance demonstrates a significant advantage for lower debt levels but that may simply be the result of technology’s growing importance in the economy and the success that has driven US technology leaders to dominate the global market capitalization leader board. The unprecedented amounts of money being directed toward investment in artificial intelligence and the effects on the cash flows of even the mega-cap technology leaders will make for an interesting debt test case in future years.
Growth of $10,000: Information Technology (12/31/2014 - 12/31/2024)
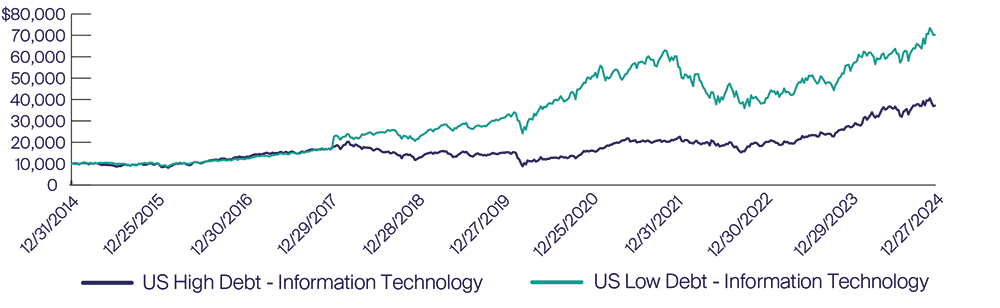
Source: Bloomberg
Conclusion
While low debt does not guarantee outperformance for every stock every day, over the long-term, we believe investors show a clear preference for greater financial stability. This leads them to assign higher valuations to the low-debt stocks and creating the opportunity for a portfolio of low-debt stocks to outperform over the cycle.
As our report shows, however, taking advantage of the benefits of low-debt investing does still require considerable attention, research, and nuance. For this reason, we encourage you to consider the benefits of active investing with Saturna Capital where low-debt factoring is a cornerstone of all of our strategies.