Saturna Sustainable Funds Quarterly Commentary - Q1 2025
Key Market Takeaways
- US Equity Underperformance in Q1 2025 – After two years of strong performance, US equities saw their largest quarterly decline since 2022, with the S&P 500 Index falling 4.27% in Q1 2025. An equal-weighted S&P 500 index underperformed further, declining 0.67%, highlighting weaker market breadth as large-cap companies drove prior gains.
- International Equities Outperform – In contrast to US markets, international equities performed strongly in Q1 2025. The MSCI EAFE Index (focused on developed markets like Europe and Japan) returned 7.01%, while the MSCI Emerging Markets Index gained 3.01%, marking a reversal of recent underperformance.
- Drivers of Market Trends – Global equity markets have been driven by three key themes since their 2022 lows: US economic exceptionalism, advancements in AI, and resilient economies. However, cracks emerged in Q1 2025, particularly in the US, as market dynamics shifted amidst broader economic challenges.
Since their 2022 nadir, global equity markets generated strong returns on the back of three main themes: 1. US economic exceptionalism, 2. artificial intelligence (AI), and 3. resilient economies. Given that triad, and the concentration of AI enablers in the US, it’s unsurprising that domestic equities outperformed their global peers. After two impressive years, cracks emerged in that three-legged stool this quarter, resulting in domestic equity underperformance.
In the first quarter of 2025, US equities posted their largest quarterly decline since 2022, with the S&P 500 Index down 4.27%. Last year, great performance from a few very large companies propelled the index. This quarter, those same companies dragged the index lower as market breadth improved. Demonstrating this dynamic, an equal-weighted S&P 500 returned -0.67%, clearly outperforming its market capitalization-weighted counterpart.
Concurrently, International Developed and Emerging Market equities outperformed in the three months ended March 31, 2025, bucking their recent underperformance. The MSCI EAFE Index, predominantly comprising developed Europe and Japan, returned 7.01%, while the MSCI Emerging Markets Index gained 3.01%.
| Total return | 2022 | 2023 | 2024 | 2025 (Q1) |
| S&P 500 Index | -18.2% | 26.3% | 25.0% | -4.3% |
| S&P 500 Equal-Weight Index | -11.6% | 13.7% | 12.8% | -0.7% |
| MSCI EAFE Index | -14.0% | 18.8% | 7.5% | 7.0% |
| MSCI Emerging Markets Index | -20.1% | 9.8% | 4.4% | 3.0% |
Outlook
US Economic Exceptionalism
The US economy has long been the envy of the developed world courtesy of a superior demographic profile, favorable geography, energy independence, and access to differentiated manufacturing hubs to the north and south. Take these structural factors and add a thriving entrepreneurial culture, deep capital markets, and robust property rights. The resulting milieu is a positive environment for wealth creation. Whether due to America’s twin deficits or attracted by the prospect of superior investment returns, record sums of global capital flowed into the US.
The return of President Donald Trump to Washington augurs accelerating isolationist policies and the desire to downsize government. We know the administration’s strategy is to increase domestic manufacturing and tariffs are the preferred tactic. The administration announced at least 13 different tariff policies over the past two months, culminating with shock and awe rates levied at global trade partners on April 2. While the announcements are intended to elicit fear and outrage, expect the shape of tariffs to continue shifting with what promises to be lengthy negotiations and myriad carveouts.
US companies benefitted greatly from the global status quo their country empowered. A credible desire to remake that status quo breeds uncertainty as beneficiaries of the preceding decades may cede their advantages. Despite policy noise, most structural factors supporting the US remain in place.
Artificial Intelligence
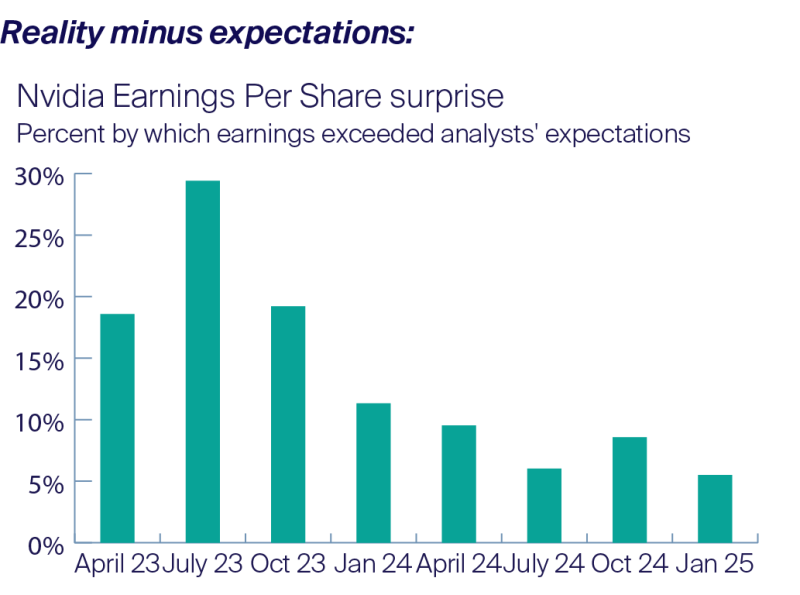
Companies across the AI value chain performed well in 2024. No company is more synonymous with AI than Nvidia, whose chips are used to both train AI models and provide their output (inference). Nvidia’s data center sales more than doubled to $115 billion in their most recent fiscal year as manufacturing capacity at Taiwan Semiconductor, rather than demand, was the limiting factor.
The AI trade is running up against a fundamental law governing markets and humans. Reality relative to expectations is more important than absolute reality, specifically in the short-term. Eventually expectations catch up to reality, which is where we are now. As the world’s most heavily scrutinized company, the market has a very good idea of Nvidia’s sales this year. Instead, the focus is on next year, as assumptions telescope on future data center spending. The purchase intentions of large cloud service providers and so-called hyperscalers (Alphabet, Microsoft, Google, Amazon, and Meta) will be carefully inspected for clues. Consternation over a possible spending slowdown have the market on edge as crowded trades exacerbate volatility.
Over the weekend of January 25 and 26, a new AI model from DeepSeek circulated among US investors and the financial press. Training the competitive model, called R1, was ostensibly far less expensive than those of the large US AI labs, threatening the more-is-more spending narrative. This concern caused a sharp selloff in AI-exposed companies, with shares of many down double digits. DeepSeek pioneered novel methods of running models more efficiently. However, this process of “reasoning” — where the model iterates to provide an optimal output — remains more compute-intensive than the previous standard.
We are in the early days of AI as capabilities and products are constantly improving. Intellectual humility is crucial. Much like envisaging the internet in the 1960s, it’s possible that we cannot even imagine what the end products and possible use cases will be. Regardless of our ability to predict the future, AI’s potential is clear and wide-ranging, illustrated by rapid adoption among individuals and businesses alike. Most hard data we’re seeing points to continued buildout of AI infrastructure.
Resilient Economies
Since 2022, global economies by and large defied expectations that a global interest rate hiking cycle — meant to combat inflation — would cause a recession. Equity markets continually climbed a wall of worry on the back of strong household consumption, government spending, and business investment. Finally, recessionary risks appeared in the rearview during late 2024 as central banks across the developed world, confident they had inflation under control, began reducing interest rates. Purportedly, the US economy was firing on all cylinders.
The new administrative regime brings policy uncertainties that call US exceptionalism into question, while simultaneously threatening global economies. A decline in US government spending would be a drag on growth, and fewer federal jobs mean higher unemployment and less household spending — America’s most important growth driver — all else equal. Faced with unclear future trade policies, businesses are postponing investment. US imports rose dramatically in the first quarter to front-run tariffs, a dynamic that will add noise to gross domestic product figures. Rising trade barriers would adversely impact economies the world over that depend on exports to the US. Tariffs and deportations come with added inflationary risks domestically and uncertain price impacts abroad. Working out economic outcomes is at best difficult when you know the policies. It’s near impossible when you’re left to assume.
The answer, as always, comes back to the health of the US consumer. So far, the labor market remains healthy with minimal signs of strain.
While we see the underlying sources of strength for each of these themes persisting, considerable uncertainty exists in the short-term. The intertwined complexity of economies means that a breakdown in one theme threatens the others. We believe that diversification and a clear mind are the most powerful antidotes to such periods of volatility.
Saturna Sustainable Equity Fund
In the first quarter of 2025, the Saturna Sustainable Equity Fund returned -3.70%, trailing the -1.22% of the S&P Global 1200 Index. The Morningstar Global Large-Stock Blend category returned -0.34% for the period. For the full year ended March 31, 2025, the Fund returned -1.33%, lagging the 7.74% for the Index and 4.75% for the category.
Contrary to the past two years, the US underperformed international equities. The portfolio’s underweight position in US equities was a performance tailwind. Technology was the worst performing global sector, followed by consumer discretionary — the only sectors down double digits — while energy was the top performer, and the only sector up double digits.1 Sector divergence was the greatest cause of portfolio underperformance, as technology is both the portfolio’s largest sector allocation and the greatest sector overweight. In accordance with the Fund’s guidelines, there is no allocation to energy, which also detracted from performance.
Investor sentiment deteriorated during the quarter as policy uncertainty accelerated in the US. The Trump administration’s ostensible desire to rip and replace the global trade regime adds economic risks. Further, the supply chains that flourished under globalization could become stranded assets as the US turns inward.
As the range of possible future outcomes widens, so does the importance of business adaptability. We’re constantly reviewing the portfolio to ensure it consists of companies capable of thriving in a variety of environments. As always, our role as stewards is not to foretell the future, but to allocate to high-quality, resilient companies.
Following a busy fourth quarter of portfolio changes, there’s less to report from the most recent quarter. We sold STMicroelectronics, a European analog semiconductor company, and last year’s largest performance detractor.
Disappointingly, the company overproduced during an inventory glut, reducing our confidence in management. We also sold PayPal, who is losing share in its various businesses across merchant acquiring, consumer payments, and payment processing. We added Fiserv, a leading merchant acquirer and core processor, who we believe has a superior product offering to PayPal.
Aviva was our greatest contributor to performance during the quarter, as pricing improved for the multiline insurer. Siemens was our second greatest contributor and top returning position, up 22%. The German industrial company benefits from a shifting policy consensus in Europe away from fiscal conservatism toward expansion. Sony, Nintendo, and Novartis round out the top five contributors.
Nvidia, the greatest contributor to performance during 2024, was the quarter’s largest decorator as the stock declined 19% amid a selloff of AI-related companies. Highlighting the fall from grace, Taiwan Semiconductor and Broadcom, both AI infrastructure providers, were among our top five detractors. Broadcom, the worst performer on the quarter, was the portfolio’s best performer during the fourth quarter of 2024 and Taiwan Semiconductor was the second-best contributor to performance during 2024. Most hard data we’re seeing points to continued buildout of AI infrastructure. ServiceNow and Novo Nordisk complete our five greatest detractors.
1 Calculated using MSCI ACWI sector weights.
As of March 31, 2025
| 10 Largest Contributors | Return | Contribution |
| AVIVA, ADR | 22.09% | 0.51 |
| Siemens, ADR | 22.09% | 0.48 |
| Sony Group, ADR | 19.99% | 0.36 |
| Nintendo, ADR | 17.36% | 0.34 |
| Novartis, ADR | 18.64% | 0.33 |
| Roche Holdings, ADR | 21.81% | 0.29 |
| Danone, ADR | 14.34% | 0.26 |
| Chubb | 9.64% | 0.24 |
| GSK, ADS | 15.80% | 0.21 |
| Eli Lilly | 7.17% | 0.19 |
| 10 Largest Detractors | Return | Contribution |
| Nvidia | -19.29% | -1.11 |
| ServiceNow | -24.90% | -0.74 |
| Novo-Nordisk, ADR | -18.00% | -0.72 |
| Taiwan Semiconductor, ADR | -15.61% | -0.70 |
| Broadcom | -27.56% | -0.69 |
| Fuji Electric | -22.68% | -0.46 |
| Apple | -11.20% | -0.38 |
| Microsoft | -10.76% | -0.28 |
| Schneider Electric, ADR | -7.49% | -0.28 |
| Adobe | -13.75% | -0.28 |
| Top 10 Holdings | Portfolio Weight |
| Nvidia | 5.01% |
| Taiwan Semiconductor, ADS | 4.09% |
| Schneider Electric, ADR | 3.63% |
| Wolters Kluwer | 3.61% |
| Eli Lilly | 3.44% |
| Novo Nordisk, ADS | 3.28% |
| Apple | 3.11% |
| Assa Abloy, ADR | 3.08% |
| Aviva PLC, ADR | 3.05% |
| Siemens, ADR | 2.83% |
Saturna Sustainable Bond Fund
For the first quarter ending March 31, 2025, the Saturna Sustainable Bond Fund returned 2.37% relative to 2.80% for the FTSE World Big Index and 2.64% for the Bloomberg Global Aggregate Index. The main reason for the performance differential was the fund’s underweight to the euro, which appreciated over 5% relative to the US dollar.
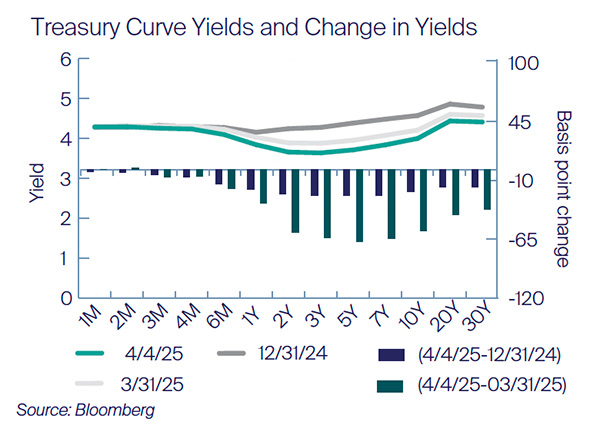
The Treasury market reacted sharply to President Donald Trump’s sweeping tariff announcement in early April, which heightened fears of a global trade conflict and economic recession. Investors flocked to safe-haven assets like US Treasuries, driving bond prices higher and yields lower. Short-term yields, such as the 2-year Treasury, have declined to 3.64% as the beginning of April, reflecting a decline in yield of 23 basis points (bps) from the end of the quarter and 58 bps from the end of last year. Similarly, the 5-year Treasury also has large movements, declining 24 bps in the first four days of the month, and more than 67 bps since the end of last year. Investors are broadly concerned about the tariffs’ potential to slow economic growth, increase inflation, and disrupt global trade flows. When looking forward to the rest of 2025, we continue to focus on holding very strong credits, while minimizing the volatility in the Fund through a conservative duration profile.
Currency
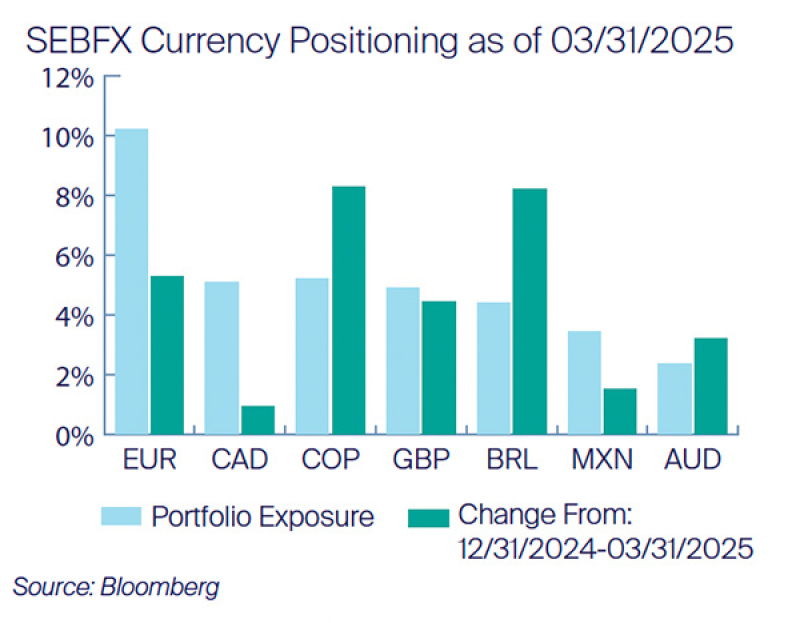
Currently the portfolio has a total exposure of 35.69% to bonds denominated in a foreign currency, up slightly from last quarter at around 30%. The Brazilian real (BRL) and Colombian peso (COP) appreciated significantly relative to the dollar last quarter, both appreciating over 8%. These currency movements were the primary driver of our best performing bonds. The BRL-denominated Asian Development bank green bond maturing in 2026 returned 10.82% last quarter, while the COP-denominated International Finance Corporation sustainability bond maturing in 2027 returned 8.24%. While the fund does have around a 10% exposure to the euro, it is a material underweight relative to the 27% generally held in the FTSE World Big Index, and about half the exposure seen in the Bloomberg Global Aggregate Index. The 5.3% appreciation of the euro relative to the US dollar benefitted both benchmarks relative to the Fund.
Both lowest performing bonds were short debt, denominated in the Mexican peso. While the peso appreciated 1.5% relative to the US dollar since the beginning of the year, the currency experienced some volatility during the quarter. Both securities the International Finance Corporation bonds of 2028, and the KFW bonds of 2025 were purchased in the middle of March, and experienced a total return of around -2%, and -2.4%, respectively.
Maturity
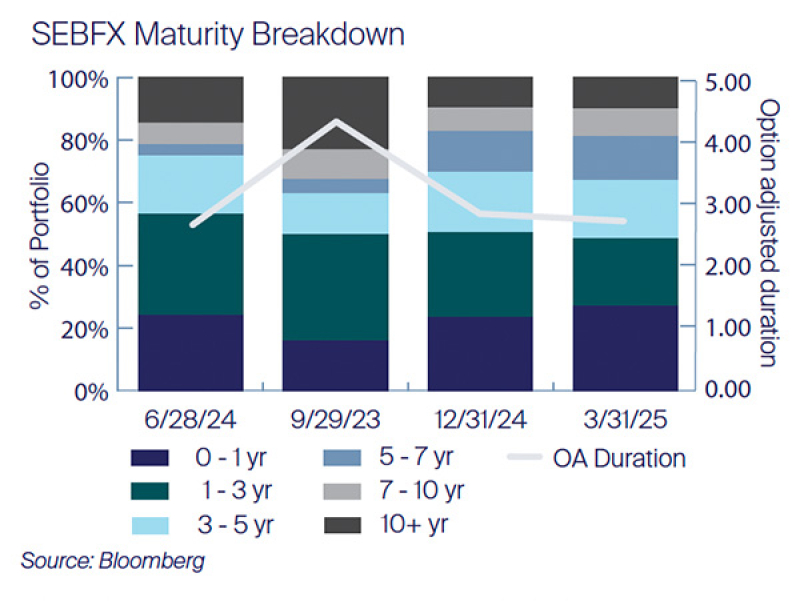
The Fund had around a 10% exposure to bonds with maturities over 10 years. The Fund increased positioning in the long maturity bucket, and bonds inside of one year, while reducing exposure to the 3–5-year maturity bucket. Overall effective duration was decreased a tenth of a year from last quarter to 2.71 years, as to minimizing expected volatility. The Saturna Sustainable Bond Fund continues to maintain a significantly shorter duration versus the Bloomberg Aggregate Index which had an effective duration of 6.45 years at quarter end, or the FTSE WorldBIG Index, which had an effective duration of 6.5 years at the end of February.
Credit Ratings
Investment grade corporate yields fell last quarter, especially inside of 10 years. We are beginning to see some spread widening, and yields rising for credits that may be more impacted by economic tumult. Yields for B-rated corporates rose in the belly of the curve, and while BB yields fell last quarter, they showed some relative weakness between 2–15 years. Last quarter the fund reduced exposure to BBB rated bonds and deployed to AAA rated debt.
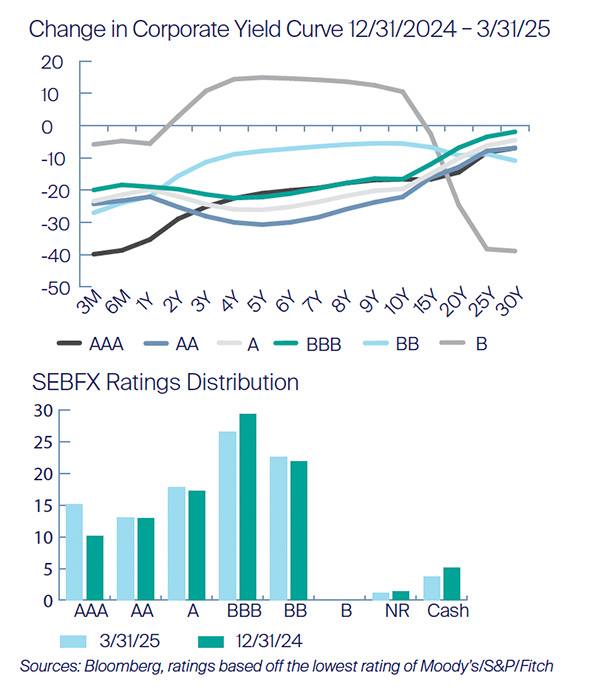
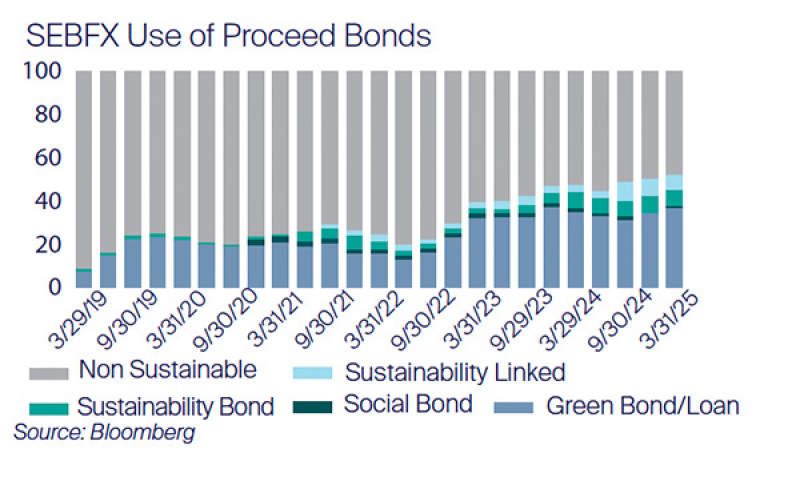
Green and Sustainable Bonds
As of quarter-end, the portfolio had 37% in green bonds, 8.48% in sustainable and social bonds, and 7.19% in sustainably linked bonds. Green bonds are primarily used to support specific climate-related or environmental projects. Social bonds raise funds to address or mitigate a specific social issue and/or seek to achieve positive social outcomes. Sustainable bonds generally can have a wider scope that simultaneously address environmental and social ambitions. Sustainably linked holdings are issues where the failure to meet a target (such as a reduction in carbon intensity over a specific timetable) results in increased payments to the bondholder, either through a higher payment upon the maturity of the security or through raising the bond’s coupon payment.
As of March 31, 2025
| Top 10 Holdings | Portfolio Weight |
| State Street Corp (5.560890% 06/15/2047) | 4.43% |
| Munich RE (1.00% 05/26/2042) | 4.35% |
| Masdar Abu Dhabi (4.875% 07/25/2029) | 4.29% |
| Koninklijke KPN (8.375% 10/01/2030) | 4.24% |
| Canadian Imperial Bank (4.375% 10/28/2080) | 4.24% |
| AXA (5.125% 01/17/2047) | 4.16% |
| First Abu Dhabi Bank PJSC (5.125% 10/13/2027) | 3.72% |
| United Utilities (6.875% 08/15/2028) | 3.62% |
| Asian Development Bank (6.00% 02/05/2026) | 3.59% |
| MAF Global Securities (7.875% 09/30/2072) | 3.55% |
Performance Summary
As of March 31, 2025
Expense Ratio1 | |||||||
| Average Annual Total Returns (Before Taxes, Net of Fees) | YTD | 1 Year | 3 Year | 5 Year | 10 Year | Gross | Net |
| Sustainable Equity Fund (SEEFX) | -3.70% | -1.33% | 3.54% | 9.86% | 7.03% | 0.91% | 0.75% |
| Bloomberg World Large & Mid Cap TR Index | -1.24% | 7.68% | 7.23% | 15.44% | 9.28% | n/a | |
| S&P Global 1200 Index | -1.22% | 7.74% | 8.17% | 16.40% | 10.07% | n/a | |
| Sustainable Bond Fund (SEBFX) | 2.37% | 1.49% | 1.00% | 1.21% | 1.34% | 0.81% | 0.65% |
| Bloomberg Global Aggregate Bond Index | 2.64% | 3.05% | -1.63% | -1.38% | 0.61% | n/a | |
| FTSE World BIG Bond Index | 2.80% | 3.20% | -1.49% | -1.61% | 0.56% | n/a | |
Performance data quoted herein represents past performance, which is no guarantee of future results. Investment return and principal value of an investment will fluctuate so that an investor’s shares, when redeemed, may be worth more or less than their original cost. Current performance may be higher or lower than the performance data quoted herein. Performance current to the most recent month-end can be obtained by visiting
www.saturnasustainable.com or calling toll-free 1-800-728-8762.
1 By regulation, expense ratios shown are as stated in the Funds’ most recent prospectus or summary prospectus, dated March31, 2025, and incorporate results from the fiscal year ended November 30, 2024. Higher expense ratios may indicate higher returns relative to a fund’s benchmark.
The S&P Global 1200 Index is a global stock market index covering nearly 70% of the world’s equity markets. The FTSE WorldBIG Index is a multi-asset, multi-currency benchmark, which provides a broad-based measure of the global fixed-income markets. Bloomberg World Large and Mid Cap Total Return Index is a float market-cap-weighted equity benchmark that covers the top 85% of market cap of the measured market. The Bloomberg Global Aggregate Bond Index is a flagship measure of global investment grade debt from a multitude of local currency markets. This multi-currency benchmark includes treasury, government-related, corporate and securitized fixed-rate bonds from both developed and emerging market issuers. When available, Saturna uses total return components of indices mentioned. Investors cannot invest directly in the indices.
Morningstar Ratings ™ A
As of March 31, 2025
Overall | 1 Year | 3 Year | 5 Year | 10 Year | Sustainability Rating™ D | |
| Sustainable Equity Fund (SEEFX) | ★★ | n/a | ★★ | ★ | ★★ | Image
|
| % Rank in Global Large-Stock Blend Category | n/a | 91 | 86 | 96 | 81 | Percent Rank in Category: 6 |
| Number of Funds in Category | 305 | 322 | 305 | 286 | 191 | Among 8,373 Global Equity Large Cap Funds |
| Sustainable Bond Fund (SEBFX) | ★★★★ | n/a | ★★★ | ★★★ | ★★★★ | Image
|
| % Rank in Global Bond Category | n/a | 84 | 41 | 38 | 27 | Percent Rank in Category: 11 |
| Number of Funds in Category | 158 | 159 | 158 | 151 | 123 | Among 2,367 Global Fixed Income Funds |
The Morningstar Sustainability Rating is not based on fund performance and is not equivalent to the Morningstar Rating (“Star Rating”).
© 2025 Morningstar®. All rights reserved. Morningstar, Inc. is an independent fund performance monitor. The information contained herein: (1) is proprietary to Morningstar and/or its content providers; (2) may not be copied or distributed; and (3) is not warranted to be accurate, complete, or timely. Neither Morningstar nor its content providers are responsible for any damages or losses arising from any use of this information.
A Morningstar Ratings™ (“Star Ratings”) are as of March 31, 2025. The Morningstar Rating™ for funds, or “star rating”, is calculated for managed products (including mutual funds, variable annuity and variable life subaccounts, exchange-traded funds, closed-end funds, and separate accounts) with at least a three-year history. Exchange-traded funds and open-ended mutual funds are considered a single population for comparative purposes. It is calculated based on a Morningstar Risk- Adjusted Return measure that accounts for variation in a managed product’s monthly excess performance (not including the effects of sales charges, loads, and redemption fees), placing more emphasis on downward variations and rewarding consistent performance. The top 10% of products in each product category receive 5 stars, the next 22.5% receive 4 stars, the next 35% receive 3 stars, the next 22.5% receive 2 stars, and the bottom 10% receive 1 star. The Overall Morningstar Rating for a managed product is derived from a weighted average of the performance figures associated with its three-, five-, and 10-year (if applicable) Morningstar Rating metrics. The weights are: 100% threeyear rating for 36-59 months of total returns, 60% five-year rating/40% three-year rating for 60-119 months of total returns, and 50% 10-year rating/30% five-year rating/20% three-year rating for 120 or more months of total returns. While the 10-year overall star rating formula seems to give the most weight to the 10-year period, the most recent three-year period actually has the greatest impact because it is included in all three rating periods.
B Morningstar Sustainability Ratings are as of February 28, 2025. The Morningstar Sustainability Rating™ is intended to measure how well the issuing companies of the securities within a fund’s portfolio are managing their environmental, social, and governance (“ESG”) risks and opportunities relative to the fund’s Morningstar category peers.
The Morningstar Sustainability Rating calculation is a two-step process. First, each fund with at least 67% of assets covered by a companylevel ESG score from Sustainalytics receives a Morningstar Portfolio Sustainability Score™. The Morningstar Portfolio Sustainability Score is an asset-weighted average of normalized company-level ESG scores with deductions made for controversial incidents by the issuing companies, such as environmental accidents, fraud, or discriminatory behavior. The Morningstar Sustainability Rating is then assigned to all scored funds within Morningstar Categories in which at least ten (10) funds receive a Portfolio Sustainability Score and is determined by each fund’s rank within the following distribution: High (highest 10%), Above Average (next 22.5%), Average (next 35%), Below Average (next 22.5%), and Low (lowest 10%). The Morningstar Sustainability Rating is depicted by globe icons where High equals 5 globes and Low equals 1 globe. A Sustainability Rating is assigned to any fund that has more than half of its underlying assets rated by Sustainalytics and is within a Morningstar Category with at least 10 scored funds; therefore, the rating is not limited to funds with explicit sustainable or responsible investment mandates. Morningstar updates its Sustainability Ratings monthly. Portfolios receive a Morningstar Portfolio Sustainability Score and Sustainability Rating one month and six business days after their reported as-of date based on the most recent portfolio. As part of the evaluation process, Morningstar uses Sustainalytics’ ESG scores from the same month as the portfolio as-of date.
The Fund’s portfolios are actively managed and are subject to change, which may result in a different Morningstar Sustainability Score and Rating each month.
The Saturna Sustainable Equity Fund was rated on 96% and the Saturna Sustainable Bond Fund was rated on 84% of Assets Under Management.
Percent Rank in Category is the fund’s total return percentile rank for the specified time period relative to all funds that have the same Morningstar category. The highest (or most favorable) percentile rank is 1 and the lowest (or least favorable) percentile rank is 100. The top-performing fund in a category will always receive a rank of 1. Percentile ranks within categories are most useful in those categories that have a large number of funds.