Saturna Mutual Funds Quarterly Commentary - Q1 2025
Key Market Takeaways
- US Equity Underperformance in Q1 2025 – After two years of strong performance, US equities saw their largest quarterly decline since 2022, with the S&P 500 Index falling 4.27% in Q1 2025. An equal-weighted S&P 500 index underperformed further, declining 0.67%, highlighting weaker market breadth as large-cap companies drove prior gains.
- International Equities Outperform – In contrast to US markets, international equities performed strongly in Q1 2025. The MSCI EAFE Index (focused on developed markets like Europe and Japan) returned 7.01%, while the MSCI Emerging Markets Index gained 3.01%, marking a reversal of recent underperformance.
- Drivers of Market Trends – Global equity markets have been driven by three key themes since their 2022 lows: US economic exceptionalism, advancements in artificial intelligence (AI), and resilient economies. However, cracks emerged in Q1 2025, particularly in the US, as market dynamics shifted amidst broader economic challenges.
Since their 2022 nadir, global equity markets generated strong returns on the back of three main themes: 1. US economic exceptionalism, 2. AI, and 3. resilient economies. Given that triad, and the concentration of AI enablers in the US, it’s unsurprising that domestic equities outperformed their global peers. After two impressive years, cracks emerged in that three-legged stool this quarter, resulting in domestic equity underperformance.
In the first quarter of 2025, US equities posted their largest quarterly decline since 2022, with the S&P 500 Index down 4.27%. Last year, great performance from a few very large companies propelled the index. This quarter, those same companies dragged the index lower as market breadth improved. Demonstrating this dynamic, an equal-weighted S&P 500 returned -0.67%, clearly outperforming its market capitalization-weighted counterpart.
Concurrently, International Developed and Emerging Market equities outperformed in the three months ended March 31, 2025, bucking their recent underperformance. The MSCI EAFE Index, predominantly comprising developed Europe and Japan, returned 7.01%, while the MSCI Emerging Markets Index gained 3.01%.
| Total return | 2022 | 2023 | 2024 | 2025 (Q1) |
| S&P 500 Index | -18.2% | 26.3% | 25.0% | -4.3% |
| S&P 500 Equal-Weight Index | -11.6% | 13.7% | 12.8% | -0.7% |
| MSCI EAFE Index | -14.0% | 18.8% | 7.5% | 7.0% |
| MSCI Emerging Markets Index | -20.1% | 9.8% | 4.4% | 3.0% |
Outlook
US Economic Exceptionalism
The US economy has long been the envy of the developed world courtesy of a superior demographic profile, favorable geography, energy independence, and access to differentiated manufacturing hubs to the north and south. Take these structural factors and add a thriving entrepreneurial culture, deep capital markets, and robust property rights. The resulting milieu is a positive environment for wealth creation. Whether due to America’s twin deficits or attracted by the prospect of superior investment returns, record sums of global capital flowed into the US.
The return of President Donald Trump to Washington augurs accelerating isolationist policies and the desire to downsize government. We know the administration’s strategy is to increase domestic manufacturing and tariffs are the preferred tactic. The administration announced at least 13 different tariff policies over the past two months, culminating with shock and awe rates levied at global trade partners on April 2. While the announcements are intended to elicit fear and outrage, expect the shape of tariffs to continue shifting with what promises to be lengthy negotiations and myriad carveouts.
US companies benefitted greatly from the global status quo their country empowered. A credible desire to remake that status quo breeds uncertainty as beneficiaries of the preceding decades may cede their advantages. Despite policy noise, most structural factors supporting the US remain in place.
Artificial Intelligence
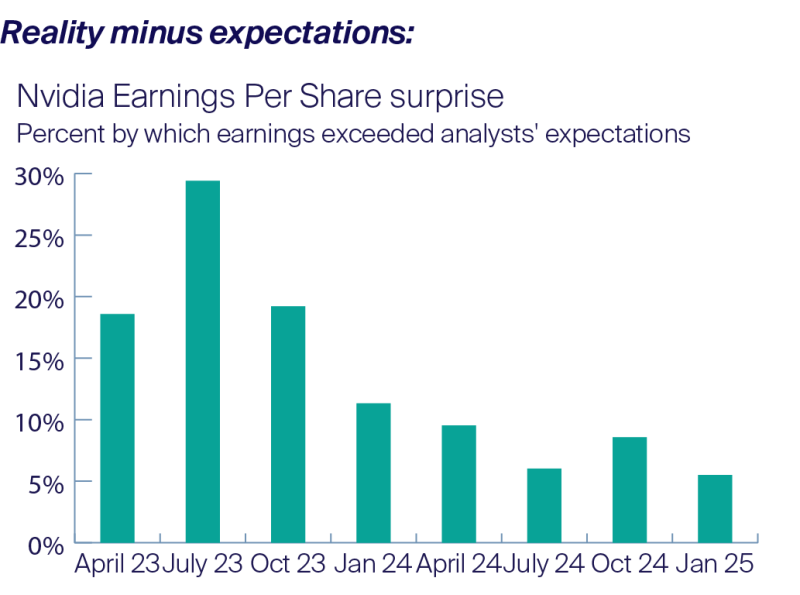
Companies across the AI value chain performed well in 2024. No company is more synonymous with AI than Nvidia, whose chips are used to both train AI models and provide their output (inference). Nvidia’s data center sales more than doubled to $115 billion in their most recent fiscal year as manufacturing capacity at Taiwan Semiconductor, rather than demand, was the limiting factor.
The AI trade is running up against a fundamental law governing markets and humans. Reality relative to expectations is more important than absolute reality, specifically in the short-term. Eventually expectations catch up to reality, which is where we are now. As the world’s most heavily scrutinized company, the market has a very good idea of Nvidia’s sales this year. Instead, the focus is on next year, as assumptions telescope on future data center spending. The purchase intentions of large cloud service providers and so-called hyperscalers (Alphabet, Microsoft, Google, Amazon, and Meta) will be carefully inspected for clues. Consternation over a possible spending slowdown have the market on edge as crowded trades exacerbate volatility.
Over the weekend of January 25 and 26, a new AI model from DeepSeek circulated among US investors and the financial press. Training the competitive model, called R1, was ostensibly far less expensive than those of the large US AI labs, threatening the more-is-more spending narrative. This concern caused a sharp selloff in AI-exposed companies, with shares of many down double digits. DeepSeek pioneered novel methods of running models more efficiently. However, this process of “reasoning” — where the model iterates to provide an optimal output — remains more compute-intensive than the previous standard.
We are in the early days of AI as capabilities and products are constantly improving. Intellectual humility is crucial. Much like envisaging the internet in the 1960s, it’s possible that we cannot even imagine what the end products and possible use cases will be. Regardless of our ability to predict the future, AI’s potential is clear and wide-ranging, illustrated by rapid adoption among individuals and businesses alike. Most hard data we’re seeing points to continued buildout of AI infrastructure.
Resilient Economies
Since 2022, global economies by and large defied expectations that a global interest rate hiking cycle — meant to combat inflation — would cause a recession. Equity markets continually climbed a wall of worry on the back of strong household consumption, government spending, and business investment. Finally, recessionary risks appeared in the rearview during late 2024 as central banks across the developed world, confident they had inflation under control, began reducing interest rates. Purportedly, the US economy was firing on all cylinders.
The new administrative regime brings policy uncertainties that call US exceptionalism into question, while simultaneously threatening global economies. A decline in US government spending would be a drag on growth, and fewer federal jobs mean higher unemployment and less household spending — America’s most important growth driver — all else equal. Faced with unclear future trade policies, businesses are postponing investment. US imports rose dramatically in the first quarter to front-run tariffs, a dynamic that will add noise to gross domestic product figures. Rising trade barriers would adversely impact economies the world over that depend on exports to the US. Tariffs and deportations come with added inflationary risks domestically and uncertain price impacts abroad. Working out economic outcomes is at best difficult when you know the policies. It’s near impossible when you’re left to assume.
The answer, as always, comes back to the health of the US consumer. So far, the labor market remains healthy with minimal signs of strain.
While we see the underlying sources of strength for each of these themes persisting, considerable uncertainty exists in the short-term. The intertwined complexity of economies means that a breakdown in one theme threatens the others. We believe that diversification and a clear mind are the most powerful antidotes to such periods of volatility.
Saturna Growth Fund
The Saturna Growth Fund Investor shares shed 8.92% in the first quarter of 2025, dragged lower by a reversal in technology shares following two years of exuberance. Concurrently, the Saturna Growth Fund Institutional shares shed 8.87%. Over the same period, the S&P 500 Index slipped 4.27%. The gap in performance resulted from a heavier exposure to poorly performing technology stocks and the absence of energy investments — the best performing sector during the quarter.
Relative to the more technology focused NASDAQ Composite Index, which dropped 10.26% during the quarter, Saturna Growth Fund relative performance was better. The key development of the first quarter was the reversal in performance of the mega-cap Magnificent Seven and the broadening of returns to other sectors, such that the equal weight S&P 500 ETF (ticker: RSP) significantly outperformed the standard market capitalization weighted benchmark.
Nothing demonstrates the first quarter reversal of fortunes more than the top contributors and detractors to Fund returns. Most of the contributors listed performed well in 2024, including Mastercard, Johnson Controls, O’Reilly, Stryker, Costco, Boston Scientific, and TJX, but none of them reached the heights of Nvidia, Broadcom, or Amazon. Meanwhile, the complete absence of the mega-cap technology stocks astounds.
We are broadly positive on the outlook for all the top contributors, although the April 2 tariff announcement creates complications. For example, Monster’s beverage can cost will rise, O’Reilly’s parts sales could be subject to levies on imports from Mexico and Canada, Costco will face a wide range of price pressures, and Mastercard may suffer from a decline in overseas travelers coming to the US, as well as American travelers worried about their reception abroad. Regardless, tariffs are across the board and, post the April 2 announcement, it appears likely that retaliatory measures will be enacted. There are few places to hide.
The turnaround in technology performance truly was stunning, as we see all but two of the top detractors hailing from that sector. Only Lululemon represents a completely different industry, while Quanta is tech adjacent as an energy provider benefitting from the development of data centers. Perhaps most telling, seven of the top detractors were included among the top contributors for all of 2024. We believe that AI, which initially sparked the tech-driven rally following Nvidia’s May 2023 earnings announcement, will remain a legitimate secular driver of economic activity for years to come.
We are, however, at that point in the cycle where vast sums of money have been invested but the economic payoff has yet to become clear. Cognizant of past land grabs in optic fiber cables and the internet, or even automobiles and the radio if you care to reach back further, investors are waiting for a clearer picture of how AI will be monetized, and which companies are best placed to succeed. At the same time, valuations had become stretched, and companies were coming off a two-year bull run. We should not be surprised by the market taking a breather, especially given the uncertainties surrounding national economic policies.
It’s a bit surprising there wasn’t greater turnover among the top positions but as it turned out, Broadcom was the only stock to depart the top ten, being replaced by TJX, which appreciated slightly during the quarter, compared to NOW’s significant sell-off.
As of March 31, 2025
| 10 Largest Contributors | Return | Contribution |
| O’ Reilly Automotive | 20.81% | 0.43 |
| Boston Scientific | 12.94% | 0.33 |
| Monster Beverage | 11.34% | 0.26 |
| Mastercard, Class A | 4.25% | 0.13 |
| Corteva | 10.79% | 0.12 |
| Costco Wholesale | 3.34% | 0.11 |
| Johnson Controls | 1.94% | 0.04 |
| TJX | 1.12% | 0.03 |
| Stryker | 3.62% | 0.03 |
| Zoetis, Class A | 1.36% | 0.01 |
| 10 Largest Detractors | Return | Contribution |
| Alphabet, Class A | -18.21% | -1.47 |
| Nvidia | -19.29% | -1.20 |
| Microsoft | -10.76% | -1.11 |
| Broadcom | -27.56% | -1.08 |
| Amazon | -13.28% | -1.06 |
| Apple | -11.20% | -1.03 |
| ServiceNow | -24.90% | -0.66 |
| Oracle | -15.88% | -0.64 |
| lululemon athletica | -25.98% | -0.42 |
| Quanta Services | -19.55% | -0.39 |
| Top 10 Holdings | Portfolio Weight |
| Microsoft | 10.04% |
| Apple | 8.37% |
| Amazon.com | 7.56% |
| Alphabet, Class A | 7.21% |
| Nvidia | 5.59% |
| Costco Wholesale | 4.89% |
| Motorola Solutions | 3.87% |
| Oracle | 3.60% |
| Mastercard, Class A | 3.53% |
| TJX Companies | 3.41% |
Saturna International Fund
In the first quarter of 2025, the Z shares of the Saturna International Fund returned -3.26% compared to a gain of 6.38% for the Bloomberg Developed Markets ex US Large & Mid Cap Index. For the same period, Saturna International Fund investor shares returned -3.27%. Consumer Discretionary and Materials led sector contribution gains, while Information Technology and Industrials were the largest detractors. The top individual contributors during the quarter were MercadoLibre (Consumer Discretionary) and SAP (IT). Detractors came from Broadcom (IT) and Novo Nordisk (Healthcare).
Investors began the year enamored with the idea of a Trump “straddle” — the protective put we are familiar with from his first term (policy pivots accommodative to markets), in addition to a growth call option (deregulation, tax cuts, and energy expansion). This framework collapsed spectacularly in the first quarter as investors realized that not only did the puts expire out-of-the-money1 the moment Treasury Secretary Scott Bessent rejected market backstops, but the call options also appear to be much more long-dated and out-of-the-money than anticipated. To top it off, these call options require very expensive premiums in the form of (among other things) a major tariff war, Defense Production Act mining mandates, and a 15%–20% federal workforce reduction.
In a nutshell, the administration’s foreign policy has shifted from transactional dealmaking to the semblance of wartime economic fortification. From Greenland mineral rights grabs, Panama Canal security overhauls, and F-35 engine reshoring, these moves suggest preparation for prolonged economic and geopolitical hostility. It also seems likely that tariffs have at least partially become a structural component of US government revenue policy.
Labor Market: Cracks Beneath the Surface
While the US unemployment rate remained steady at 3.9% in February, a closer look into forward-looking dynamics paint a different picture. Temporary help employment fell by combined 24,400 jobs in January and February, marking the steepest consecutive monthly declines outside of recessions since 2001. This sector is often a bellwether for labor demand, as companies typically adjust temporary staffing first in response to economic uncertainty. Small businesses are also showing signs of retreat. According to the National Federation of Independent Business’ February jobs report, only a net 15% of small business owners plan to create new jobs in the next three months, down three points from January and matching levels last seen during the 2016 manufacturing slowdown.
These developments are reflected in a deteriorating Beveridge Curve — a measure of labor market efficiency that compares job openings to unemployment. The ratio of job openings to unemployed workers has fallen from its peak of roughly 1.9 in early 2023 to 1.07 in February 2025. The takeaways is that while layoffs remain subdued, employers are quietly pulling back on hiring plans and struggling to match available workers with open roles.
Labor Market: Cracks Beneath the Surface
Attempting to predict short- or medium-term policy outcomes in today’s environment is both impractical and unproductive. The administration’s evolving tariff strategy — split between transactional deals with allies and strategic measures aimed at rebuilding domestic industrial capacity — introduces significant uncertainty. While transactional tariffs may spur one-off agreements with trade partners like the UK, Japan, and Canada, strategic tariffs targeting industries such as steel, aluminum, automotive, and minerals are likely to remain structural. These policies reflect a broader effort to reduce US vulnerability in the face of geopolitical volatility or hostility, potentially reshaping global trade dynamics over the long term.
Against this backdrop, our investment approach remains steadfast: focusing on high-quality companies with recession-resilient business models that compound value over time. These category leaders — often with pricing power, global supply chain flexibility, and exposure to essential demand — are well-positioned to navigate volatile policy environments and deliver durable returns across cycles. We prioritize firms capable of offsetting margin pressures through productivity gains and innovation, ensuring portfolios remain anchored in fundamentals rather than speculative forecasts. While the near-term may be marked by heightened volatility, we believe this disciplined focus on long-term quality will continue to drive superior risk-adjusted outcomes for our investors.
1 A put option expires out-of-the-money if the underlying stock price does not reach the strike price. In this analogy, investors expected the administration would back off on policy if markets sold off aggressively. This did not happen.
As of March 31, 2025
| 10 Largest Contributors | Return | Contribution |
| MercadoLibre | 14.73% | 0.94 |
| SAP, ADR | 9.03% | 0.47 |
| Dassault Systemes, ADR | 10.77% | 0.44 |
| Iberdrola | 19.23% | 0.38 |
| Linde | 11.59% | 0.31 |
| Nintendo | 15.55% | 0.23 |
| Alcon | 11.83% | 0.22 |
| Danone | 13.48% | 0.19 |
| Hermes International | 8.45% | 0.17 |
| AstraZeneca, ADR | 13.77% | 0.14 |
| 10 Largest Detractors | Return | Contribution |
| Broadcom | -27.56% | -1.90 |
| Novo-Nordisk, ADR | -18.00% | -1.18 |
| Taiwan Semiconductor, ADR | -15.61% | -1.01 |
| Fuji Electric | -22.68% | -0.71 |
| Eaton | -17.78% | -0.45 |
| Nice, ADR | -9.23% | -0.38 |
| Wolters Kluwer | -6.64% | -0.37 |
| Schneider Electric | -8.74% | -0.29 |
| Prysmian | -14.80% | -0.27 |
| Ferguson Enterprises | -7.21% | -0.27 |
| Top 10 Holdings | Portfolio Weight |
| MercadoLibre | 7.70% |
| Wolters Kluwer | 6.27% |
| Taiwan Semiconductor, ADS | 6.02% |
| Dassault Systemes, ADR | 5.47% |
| Broadcom | 5.46% |
| ASML Holding NY | 5.41% |
| Novo Nordisk, ADS | 5.40% |
| SAP, ADS | 5.07% |
| NICE Systems, ADR | 4.35% |
| Ferguson Enterprises | 3.63% |
Saturna Global High Income Fund
The Saturna Global High Income Fund returned 6.23% in the first quarter of 2025. The Fund’s equity benchmark, the S&P Global 1200 Index, returned -1.22%, while its fixed income benchmark, the Bloomberg Barclays Global High Yield Corporate Index, returned 1.95%. The Fund’s Morningstar Global Allocation category returned 2.12% during the quarter.
Factors Influencing Performance
President Donald Trump’s aggressive rollout of trade and tariff actions in the first weeks of his administration amplified concerns about their impacts on the global economy. With many of these actions focused on US trade with Canada, Mexico, and China, international stocks outperformed US stocks, while income-oriented equities also outperformed growth-oriented stocks. These factors helped drive the strong outperformance of the Saturna Global High Income Fund during the quarter.
Telecom stocks performed strongly, with Orange returning 31.40% and Telenor returning 27.86%. Detractors to performance included Woodside Energy and miner South 32.
Looking Ahead
We expect the US trade strategy to involve additional confrontation and multiple rounds of fraught negotiation. Before even weighing the economic impacts of the trade measures themselves, the heightened uncertainty around the changes to come to global trading relations makes it increasingly difficult for long-term capital investment planning and supply chain management, and a slowdown in investment can have a near term impact on economic growth. We feel like the positive results for the Fund in the first quarter in this kind of environment bode well for the road ahead as well.
As of March 31, 2025
| 10 Largest Contributors | Return | Contribution |
| Skandinaviska Enskilda, Class A | 19.47% | 0.85 |
| Telenor | 27.86% | 0.78 |
| ORANGE, ADR | 31.40% | 0.77 |
| Nintendo | 15.55% | 0.63 |
| Novartis, ADR | 18.64% | 0.57 |
| Shell, ADR | 18.21% | 0.54 |
| Verizon Communications | 15.46% | 0.43 |
| GSK, ADS | 15.80% | 0.42 |
| Southern Copper | 4.09% | 0.29 |
| Virtu Financial, Class A | 7.54% | 0.27 |
| 10 Largest Detractors | Return | Contribution |
| ARGV 4.125 07/09/46 '25 Cpn step 5.000 on 07/09/28 | -6.62% | -0.12 |
| Woodside Energy Group, ADR | -3.70% | -0.06 |
| South32, ADR | -2.09% | -0.02 |
| ARGV 1.000 07/09/29 '25 | -5.06% | -0.01 |
| TX 7.625 10/01/42 '25 | 2.02% | 0.01 |
| FNMA 5.000 01/23/29 '25 | 1.11% | 0.01 |
| CT 5.798 11/15/45 '34 | 0.75% | 0.02 |
| FHLB 4.500 12/04/29 '26 | 2.27% | 0.03 |
| COGV 8.375 02/15/27 | 1.85% | 0.03 |
| DAL 3.750 10/28/29 '29 | 0.94% | 0.03 |
| Top 10 Holdings | Portfolio Weight |
| Southern Copper | 4.50% |
| Skandinaviska Enskilda, Class A | 3.85% |
| Nintendo | 3.19% |
| Cisco Systems | 2.88% |
| Virtu Financial | 2.67% |
| Telenor, ASA | 2.67% |
| Novartis, ADS | 2.60% |
| Shell | 2.60% |
| ANZ Group Holdings, ADR | 2.56% |
| Verizon Communications | 2.54% |
Saturna Core Fund
The Saturna Core Fund returned -0.72% in the first quarter of 2025. A 60/40 blend of the Fund’s S&P Global 1200 Index and Bloomberg US Aggregate benchmarks returned 0.40% for the quarter. During the quarter, the Fund’s asset allocation largely remained stable, with the share of equities decreasing slightly and bonds increasing, due to divergent performance across the asset classes. The Fund continues to find value in short-term treasuries but cut holdings here from 21.30% at year-end 2024 to 9.72% at the end of first-quarter 2025.
Equities
The Saturna Core Fund’s mandate allocates a 60% weight in equity securities, with two-thirds being US-domiciled companies and one-third foreign-domiciled. The Fund generally holds equity positions in larger companies with strong balance sheets; the average market capitalization of positions held by the Fund was $364.6 billion with an average of 20% total debt to market capitalization at year-end. The Fund’s 59.48% equity allocation was comprised of 60 positions across 16 countries. The largest sector of the equity portfolio was Technology, followed by Industrials, and Materials.
Defensive companies dominated the top contributors in the first quarter. Agnico Eagle, a Canadian gold miner was the fund’s largest contributor. During the quarter gold prices saw a strong rise as the dollar weakened and nations prepared for the looming threat of a trade war. At the other end of the spectrum, AI and related infrastructure names were common among the largest detractors from fund performance. After several strong years, investors in the AI theme were spooked by claims from Chinese AI startup Deepseek that suggested a possibility for lower investments in AI infrastructure. While Western firms have largely doubled down on AI-related capital expenditures, investors have become more cautious. We continue to maintain a balanced investment approach, seeking diversification across secular themes and geographies.
Fixed Income
The Saturna Core Fund targets an allocation of 40% cash and investment-grade fixed-income securities. After several years where the Federal Reserve was the only game in town, it’s now solidly on the bench. Like wider markets, Chair Jerome Powell has made clear, the Fed is in wait-and-see mode regarding tariffs. On one hand tariffs could be inflationary. On the other, they could limit growth. As growth concerns began to emerge, we moved to slightly increase duration, staying in high-quality bonds, to protect against the risk of a souring economy.
Looking Forward
A volatile first quarter showed the value of a balanced portfolio. Further volatility could lie ahead, partly due to uncertainty. Investors have a disdain for the unknown and the current administration has penchant for its use in negotiations. More interesting, from a long-term perspective, is the rewiring of global trade and capital flows. The basis for tariffs is simple — reshore manufacturing, rejuvenate the middle class.
The lasting implications are far more complicated. For the past 20-plus years, America has seen manufacturing jobs move abroad, turning the country’s once small trade deficit into a massive one. While American’s imported goods, we exported the dollar, leading to an equally massive inflow of foreign investments. Unwinding this balance of payments could cause liquidity to flow into international equities. We see this mix of volatility and rewiring of global trade as supportive for a globally diversified portfolio.
As of March 31, 2025
| 10 Largest Contributors | Return | Contribution |
| Agnico Eagle Mines | 39.19% | 0.84 |
| Danone Sponsored France, ADR | 14.34% | 0.20 |
| SAP, ADR | 9.03% | 0.18 |
| O’ Reilly Automotive | 20.81% | 0.17 |
| Republic Services | 20.72% | 0.17 |
| AstraZeneca, ADR | 13.77% | 0.17 |
| Corteva | 10.79% | 0.16 |
| AutoZone | 19.07% | 0.16 |
| Visa, Class A | 11.08% | 0.14 |
| Boston Scientific | 12.94% | 0.14 |
| 10 Largest Detractors | Return | Contribution |
| Broadcom | -27.56% | -0.62 |
| Eaton | -17.78% | -0.39 |
| Alphabet, Class A | -18.21% | -0.37 |
| Nvidia | -19.29% | -0.35 |
| Oracle | -15.88% | -0.32 |
| Novo-Nordisk, ADR | -18.00% | -0.32 |
| Apple | -11.20% | -0.30 |
| Microsoft | -10.76% | -0.29 |
| Taiwan Semiconductor, ADR | -15.61% | -0.28 |
| Fuji Electric | -22.68% | -0.26 |
| Top 10 Holdings | Portfolio Weight |
| United States Treasury Bond | 2.96% |
| United States Treasury Bond | 2.79% |
| Agnico-Eagle Mines | 2.56% |
| Maryland St Cmnty Dev Admin Dept | 2.47% |
| Microsoft | 2.20% |
| Comcast | 1.98% |
| BRKHEC (Pacificorp) | 1.97% |
| Apple | 1.92% |
| Dominion Energy | 1.83% |
| Oracle | 1.76% |
Saturna Short-Term Bond Fund, Saturna Bond Income Fund
The Saturna Short-Term Bond Fund returned 1.35% during the first quarter of 2025, underperforming its benchmark, the US Bloomberg Aggregate Index, which returned 2.78%. The Fund also underperformed the Bloomberg US Aggregate 1-3 Year Bond Index, which returned 1.63% over the quarter. The primary reason for the performance differential was the Fund’s high allocation to securities with less than one year to maturity, which exhibited weaker performance relative to securities with a longer time to maturity.
The Saturna Bond Income Fund returned 2.75% during the first quarter of 2025, compared to 2.78% for the Fund’s benchmark, the Bloomberg US Aggregate Index. The primary reason for the underperformance was the Fund’s underweighting of assets with 3–7 years to maturity, a category that outperformed over the quarter.
Ahead of President Donald Trump’s inauguration on January 20, equity markets rallied, and bond markets wavered, reflecting expectations of strong domestic output, elevated inflationary pressures, and a business-friendly operating environment. Following the inauguration day, markets stabilized as investors looked for clues to determine potential catalysts for a new directional trend. No solace was found during the January 31 Federal Open Market Committee meeting, when the Federal Reserve opted to hold interest rates steady following three consecutive rate cuts. Uncertainty remained elevated, as a lack of clear outlook regarding tariffs, border enforcement, foreign affairs, and tax policy necessitated a wait-and-see approach. This brief period of consolidation did not last long, and on February 18, a new trend emerged: equities weakened, and bonds gained traction, reflecting a notable shift in investor preferences.
While the inflection point is clear looking back, it was not one specific factor that drove this new trend. Instead, the recent trend stemmed from a symphony of damaging forces, including erratic tariff policy, diminishing diplomacy amid international conflict, and pushback against the Department of Government Efficiency’s obtuse cost cutting measures. In response, consumer sentiment deteriorated rapidly. Simultaneously, businesses expressed fewer hiring plans, business confidence surveys faltered, and US Manufacturing Purchasing Managers’ Indices moved from expansionary readings back to near-neutral levels. These surveys reflect a precarious and sensitive operating environment, aligning with the market’s flight to safer assets, where capital allocators moved from equities to bonds. One major question remains to be answered: when will the weak forward expectations translate into the “hard data” such as gross domestic product growth, unemployment, and corporate earnings?
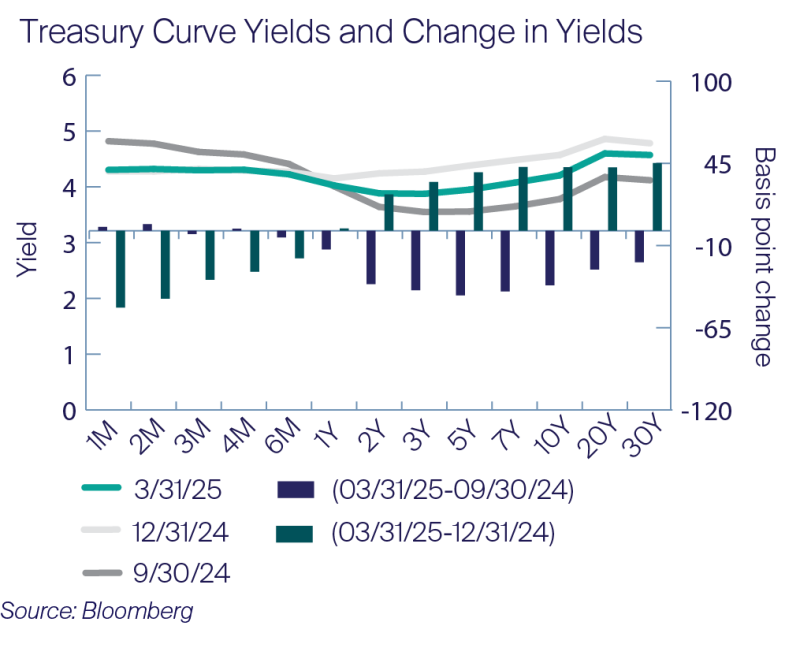
So far in 2025, the downward shift across the yield curve is a clear message through a cloudy outlook: the market believes that the negative impact on domestic output growth currently outweighs the oppositional forces of elevated inflation expectations and an expanding fiscal deficit, both of which place upward pressure on long-term bond yields. Bond returns are enhanced when treasury yields fall, but they are also sensitive to changes in credit spreads, which are a lens into the overall health of issuers. Credit spreads began to inflect upward during the first quarter, a notable departure from the multi-year downtrend that began in mid-2022. Going forward, there is further potential for credit spread widening which may partially offset any duration-driven tailwind from falling yields. Being that uncertainty in the market is unavoidable, the pillars of our mitigation approach follow: diversify among quality issuers, focus on prudent management of risk, and temper a reactionary mindset. These principles will continue to drive our investment framework, improving our resiliency to weather any storm ahead.
Saturna Bond Income Fund
The two primary reasons for the underperformance of the Saturna Bond Income Fund were a lower allocation to 3–5-year securities, and weaker performance of securities with a maturity of less than one year. That said, the Fund’s performance was generally in-line with its benchmark, with a mere -0.03% performance differential.
As of March 31, 2025, the Fund had 7.15% of assets invested in the 3–5-year bucket, compared to 19.94% for the benchmark. Over the quarter, the yield curve realized a pronounced downward shift in the “belly” of the curve, otherwise the middle section of the curve that encompasses securities with 3–7 years to maturity. This notable shift drove outperformance for securities with maturities within this section of the curve, and thus the under-allocation of the Fund in this category detracted from performance. At the same time, the Fund had a 9.29% allocation to securities with a maturity of less than one year, compared to 0.09% for the benchmark. This was the weakest performing section of the treasury curve, as short-term interest rates stayed relatively anchored over the quarter, while rates fell across the remainder of the curve.
The Fund’s weakest performing assets were a 2025 bond from Affiliated Managers Group, and a floating-rate security from State Street Corporation, even though both of which exhibited positive returns. In the first quarter of 2025, the financial services industry held up reasonably well, but these positions were detractors due to their short duration, limiting the positive benefit of duration effects as yields moved lower. One other detractor was a 2036 corporate bond from Lowes Companies, which returned 1.29% over the quarter. As can be observed, no held bonds realized a negative total return in the first quarter.
Over the quarter, corporate spreads widened in response to the considerable market volatility and an uncertain outlook. Higher quality holdings, including treasuries, AAA, and AA-rated securities outperformed their credit-riskier counterparts. The Fund’s three strongest contributors were two long-term treasury bonds maturing in 2039 and 2048, as well as an agency bond from the Federal Home Loan Bank that matures in 2044. Other top performers were high-quality corporate bonds and long-term taxable municipal bonds, reflecting the flight to safer assets over the quarter. Looking ahead, the Fund’s current positioning will remain focused on creditworthy issuers with strong balance sheets, with a willingness to exchange return potential for volatility reduction.
Saturna Short-Term Bond Fund
The Saturna Short-Term Bond Fund ended the quarter with a duration of 1.73 years, well below the 6.06-year duration of the Bloomberg US Aggregate Index and near the Bloomberg US Aggregate 1-3 Year Index’s duration of 1.86 years. The Fund underperformed its benchmark, the Bloomberg US Aggregate Index, by 1.43% in the first quarter of 2025. The Fund also underperformed the Bloomberg US Aggregate 1-3 Year Index, an index that better matches the Fund’s short-term allocation, by a smaller 0.28%. The primary reason for the underperformance was an overallocation to securities with a maturity of less than one year.
Over the quarter, the yield curve realized a pronounced downward shift in the “belly” of the curve, otherwise the middle section of the curve that encompasses securities with 3–7 years to maturity. At the same time, yields on treasury securities with a maturity of less than one year were virtually unchanged during the quarter. Together, the fund benefited from the allocation to securities in the 3–5-year section of the curve, but this strength was outweighed by the relative weakness in holdings with a maturity of less than one year, leading to underperformance compared to the benchmarks.
The Fund’s holdings in treasury bonds maturing in 2029 were the two top performers over the quarter, stemming from duration effects as treasury yields moved lower. A corporate bond from Verizon Communications and an agency bond from the Federal Home Loan Bank, both of which mature in 2029, were also top performers, driven by duration effects relating to yield movements. Conversely, the Fund’s allocation to short term treasuries with maturities in 2025 were the three primary detractors from fund performance.
As bond market volatility remains elevated, the Fund has a bias toward quality holdings, and the duration is positioned in-line with its secondary benchmark, enhancing adaptability to future market conditions.
As of March 31, 2025
| Saturna Short-Term Bond Fund | |
| Top 10 Holdings | Portfolio Weight |
| United States Treasury Bond (6.125% 08/15/2029) | 8.20% |
| United States Treasury Note (2.625% 12/31/2025) | 5.94% |
| US Treasury N/B (2.250% 08/15/2027) | 5.74% |
| US Treasury N/B (2.375% 05/15/2027) | 5.01% |
| US Treasury N/B (1.50% 02/15/2025) | 4.81% |
| Florida Power & Light (2.85% 04/01/2025) | 3.36% |
| United States Treasury Note (2.875% 04/30/2025) | 3.20% |
| Federal Farm Credit Bank (4.80% 11/13/2029) | 3.20% |
| Bank of America (3.50% 04/19/2026) | 3.17% |
| Visa (3.15% 12/14/2025) | 2.78% |
| Saturna Bond Income Fund | |
| Top 10 Holdings | Portfolio Weight |
| United States Treasury Bond (4.25% 05/15/2039) | 6.84% |
| United States Treasury Bond (3.375% 11/15/2048) | 4.10% |
| United States Treasury Bond (5.375% 02/15/2031) | 3.93% |
| Apple (4.50% 02/23/2036) | 3.20% |
| Microsoft (4.20% 11/03/2035) | 3.13% |
| Intel (4.00% 12/15/2032) | 3.03% |
| Home Depot (5.875% 12/16/2036) | 2.96% |
| Massachusetts Housing Finance Agency (5.989% 12/01/20244) | 2.81% |
| Maryland Community Development Administration (5.991% 09/01/2044) | 2.81% |
| Minnesota Housing Finance Agency (5.925% 07/01/2049) | 2.79% |
Performance Summary
As of March 31, 2025
| Average Annual Total Returns (before taxes, net of fees) | YTD | 1 Year | 3 Year | 5 Year | 10 Year | 15 Year | Expense Ratio1 |
| Saturna Growth Fund Investor Shares (SSGFX) | -8.92% | 3.84% | 5.96% | 15.49% | 10.82% | 11.32% | 0.96% |
| Saturna Growth Fund Z Shares (SGZFX)2 | -8.87% | 4.05% | 6.22% | 15.77% | n/a | n/a | 0.72% |
| Bloomberg US Large Cap Index | -4.53% | 8.27% | 8.93% | 18.52% | 12.53% | 13.19% | n/a |
| Bloomberg 1000 Growth Index | -7.76% | 7.35% | 8.80% | 18.56% | 13.85% | 14.53% | n/a |
| S&P 500 Index | -4.27% | 8.25% | 9.06% | 18.59% | 12.50% | 13.15% | n/a |
| Morningstar "Large Growth" Category | -8.49% | 5.01% | 7.76% | 16.99% | 12.61% | 13.13% | n/a |
| Saturna International Fund Investor Shares (SSIFX) | -3.37% | -8.63% | 1.95% | 10.06% | 6.49% | 5.41% | 0.96% |
| Saturna International Fund Z Shares (SIFZX)2 | -3.26% | -8.43% | 2.19% | 10.30% | n/a | n/a | 0.73% |
| Bloomberg Developed Markets ex US Large & Mid Cap Index | 6.38% | 5.98% | 6.38% | 12.82% | 6.10% | 5.98% | n/a |
| MSCI EAFE Index | 7.01% | 5.41% | 6.60% | 12.31% | 5.91% | 6.15% | n/a |
| Morningstar "Foreign Large Growth" Category | 2.89% | 1.27% | 2.65% | 9.09% | 5.53% | 6.12% | n/a |
| Saturna Core Fund (SCORX) | -0.72% | 3.79% | 3.76% | 8.56% | 5.58% | 5.84% | 0.74% |
| Bloomberg Developed Markets Large & Mid Cap Index | -1.75% | 7.48% | 8.07% | 16.56% | 10.00% | 10.07% | n/a |
| Bloomberg Global Equity/Fixed Income 60/40 Index | 0.03% | 5.79% | 4.25% | 9.28% | 6.21% | 4.10% | n/a |
| Bloomberg US Aggregate Index | 2.78% | 4.88% | 0.52% | -0.40% | 1.46% | 2.44% | n/a |
| S&P Global 1200 Index | -1.22% | 7.74% | 8.17% | 16.40% | 10.07% | 10.15% | n/a |
| 60|40 S&P Global 1200|Bloomberg US Aggregate Index | 0.40% | 6.65% | 5.21% | 9.59% | 6.78% | 7.25% | n/a |
| Dow Jones Moderate Portfolio Index | 0.14% | 4.78% | 3.16% | 8.53% | 5.59% | 6.59% | n/a |
| Morningstar "Moderate Allocation" Category | -0.31% | 5.41% | 4.30% | 10.14% | 6.33% | 7.30% | n/a |
| Saturna Global High Income Fund (SGHIX)3 | 6.23% | 7.57% | 3.15% | 7.54% | 4.82% | n/a | 0.75%4 |
| Bloomberg Developed Markets Large & Mid Cap Index | -1.75% | 7.48% | 8.07% | 16.56% | 10.00% | 10.07% | n/a |
| Bloomberg Global Equity/Fixed Income 50/50 Index | 0.47% | 5.35% | 3.28% | 7.47% | 5.45% | n/a | n/a |
| Bloomberg Global High Yield Corp Index | 1.95% | 7.86% | 4.69% | 6.71% | 4.54% | 5.59% | n/a |
| S&P Global 1200 Index | -1.22% | 7.74% | 8.17% | 16.40% | 10.07% | 10.15% | n/a |
| Morningstar "Global Allocation" Category | 2.12% | 5.31% | 3.49% | 9.33% | 4.61% | 5.69% | n/a |
| Saturna Short-Term Bond Fund (STBFX) | 1.35% | 4.63% | 2.59% | 1.51% | 1.48% | 1.43% | 0.60%4 |
| Bloomberg US Aggregate Index | 2.78% | 4.88% | 0.52% | -0.40% | 1.46% | 2.44% | n/a |
| Bloomberg US Aggregate 1-3 Year Index | 1.63% | 5.61% | 3.11% | 1.50% | 1.71% | 1.59% | n/a |
| Morningstar "Short-Term Bond" Category | 1.68% | 5.91% | 3.41% | 2.70% | 2.07% | 2.14% | n/a |
| Saturna Bond Income Fund (SBIFX) | 2.75% | 3.82% | -0.92% | -1.18% | 1.00% | 2.36% | 0.65%4 |
| Bloomberg US Aggregate Index | 2.78% | 4.88% | 0.52% | -0.40% | 1.46% | 2.44% | n/a |
| FTSE US Broad Investment-Grade Bond Index | 2.78% | 4.97% | 0.48% | -0.41% | 1.47% | 2.44% | n/a |
| Morningstar "Long-Term Bond" Category | 2.66% | 3.01% | -2.36% | -1.09% | 1.67% | 4.37% | n/a |
Performance data quoted represents past performance, is before any taxes payable by shareowners, and is no guarantee of future results. Current performance may be higher or lower than that stated herein. Performance current to the most recent month-end is available by calling toll-free 1-800-728-8762 or visiting www.saturnafunds.com. Average annual total returns are historical and include change in share value as well as reinvestment of dividends and capital gains, if any. The investment return and principal value of an investment will fluctuate so that an investor's shares, when redeemed, may be worth more or less than their original cost. Shares of a fund may only be offered for sale through the fund's prospectus or summary prospectus.
1 By regulation, expense ratios shown are as stated in the Funds' most recent prospectus or summary prospectus, dated March 29, 2024, and incorporate results from the fiscal year ended November 30, 2023. Higher expense ratios may indicate higher returns relative to a fund's benchmark.
2 Z Shares of Saturna Growth and Saturna International Funds began operations June 2, 2017.
3 Saturna Global High Income Fund began operations March 30, 2012.
4The adviser has committed through March 31, 2026, to waive fees and/or reimburse expenses to the extent necessary to ensure that the Fund's net operating expenses, excluding brokerage commissions, interest, taxes, and extraordinary expenses, do not exceed the net operating expense ratio of 0.75% for Saturna Global High Income Fund, 0.60% for Saturna Short-Term Bond Fund, and 0.65% for Saturna Bond Income Fund. This expense limitation agreement may be changed or terminated only with approval of the Board of Trustees.
The Bloomberg Global High Yield Corporate Bond Index is a rules-based, market value-weighted index engineered to measure the non-investment grade, fixed-rate, taxable, global corporate bond market.
The Bloomberg US Aggregate 1-3 Year Bond Index tracks bonds with 1-3 year maturities within the flagship Bloomberg US Aggregate Bond Index.
The Bloomberg US Aggregate Bond Index is a broad-based, flagship benchmark that measures the investment-grade, US dollar-denominated, fixed-rate taxable bond market.
The Bloomberg GlobalAgg Index is a flagship measure of global investment grade debt from a multitude of local currency markets. This multi-currency benchmark includes treasury, government-related, corporate and securitized fixed-rate bonds from both developed and emerging market issuers.
The Bloomberg US Aggregate Bond Index is a broad-based, flagship benchmark that measures the investment-grade, US dollar-denominated, fixed-rate taxable bond market.
60% / 40% S&P Global 1200 Index / Bloomberg US Aggregate Index blends the S&P Global 1200 Index with the Bloomberg US Aggregate Index by weighting their total returns at 60% and 40%, respectively. The blend is rebalanced monthly and results reflect the reinvestment of dividends gross of foreign withholding taxes.
Bloomberg Developed Markets exUS Large & Mid Cap Total Return Index is a float market-cap-weighted equity benchmark that covers the top 85% of market cap of the measured market.
Bloomberg Developed Markets Large & Mid Cap Total Return Index is a float market-cap-weighted equity benchmark that covers the top 85% of market cap of the measured market.
Bloomberg World Large and Mid Cap Total Return Index is a float market-cap-weighted equity benchmark that covers the top 85% of market cap of the measured market.
Bloomberg US 1000 Growth Total Return Index provides exposure to companies with superior growth factor scores based on their earnings yield, valuation, dividend yield, and growth.
Bloomberg US Large Cap Total Return Index is a float market-cap-weighted benchmark of the 500 most highly capitalized US companies.
Bloomberg Global EQ:FI 50:50 Index is designed to measure cross-asset market performance globally. The index rebalances monthly to 50% equities and 50% fixed income. The equities and fixed income are represented by Bloomberg Developed Markets Large & Mid Cap Total Return Index and the Bloomberg Global Aggregate Index respectively.
Bloomberg Global EQ:FI 60:40 Index is designed to measure cross-asset market performance globally. The index rebalances monthly to 60% equities and 40% fixed income. The equities and fixed income are represented by Bloomberg Developed Markets Large & Mid Cap Total Return Index and the Bloomberg Global Aggregate Index respectively.
The Dow Jones Moderate Portfolio Index is a broad-based index of stock and bond prices.
The FTSE US Broad Investment-Grade Bond Index is a broad-based index of medium and long-term investment-grade bond prices.
The MSCI EAFE Index is an international index focused on Europe, Australasia, and the Far East.
The MSCI ACWI Index, produced by Morgan Stanley Capital International, measures equity market performance throughout the world.
The NASDAQ Composite Index measures the performance of more than 5,000 US and non-US companies traded "over the counter" through NASDAQ.
The S&P 500 Index is an index comprised of 500 widely held common stocks considered to be representative of the US stock market in general.
The S&P 500 Equal Weight Index (EWI) is the equal-weight version of the widely-used S&P 500. The index includes the same constituents as the capitalization weighted S&P 500, but each company in the S&P 500 EWI is allocated a fixed weight - or 0.2% of the index total at each quarterly rebalance.
The S&P Global 1200 Index is a global stock market index covering nearly 70% of the world's equity markets.
When available, Saturna uses total return components of indices mentioned. Investors cannot invest directly in the indices.
A fund's 30-Day Yield, sometimes referred to as standardized yield, current yield, or SEC yield, is based on methods of computation prescribed in SEC Form N-1A. Calculated by dividing the net investment income per share during the preceding 30 days by the net asset value per share on the last day of the period, the 30-Day Yield provides an estimate of a fund's investment income rate, but may not equal the actual income distribution rate.
Morningstar Ratings™ A
As of March 31, 2025
| Overall | 1 Year | 3 Year | 5 Year | 10 Year | 15 Year |
|---|---|---|---|---|---|---|
Saturna Growth Fund – "Large Growth" Category | ||||||
Investor Shares (SSGFX) | n/a | ★★★ | ★★★ | ★★ | n/a | ★★★ |
% Rank in Category | 62 | 78 | 75 | 85 | 87 | n/a |
Z Shares (SGZFX) | n/a | ★★★ | ★★★ | ★★ | n/a | ★★★ |
% Rank in Category | 59 | 75 | 70 | 82 | 86 | n/a |
Number of Funds in Category | 1,079 | 1,027 | 949 | 745 | 582 | 1,027 |
Saturna International Fund – "Foreign Large Growth" Category | ||||||
Investor Shares (SSIFX) | n/a | ★★★ | ★★★ | ★★★★ | n/a | ★★★★ |
% Rank in Category | 100 | 59 | 41 | 27 | 74 | n/a |
Z Shares (SIFZX) | n/a | ★★★ | ★★★ | ★★★★ | n/a | ★★★ |
% Rank in Category | 99 | 57 | 40 | 23 | 66 | n/a |
Number of Funds in Category | 389 | 369 | 335 | 213 | 158 | 369 |
Saturna Core Fund – "Moderate Allocation" Category | ||||||
(SCORX) | n/a | ★★★ | ★★ | ★★★ | n/a | ★★★ |
% Rank in Category | 82 | 66 | 84 | 74 | 88 | n/a |
Number of Funds in Category | 707 | 682 | 628 | 490 | 363 | 682 |
Saturna Global High Income Fund – "Global Allocation" Category | ||||||
(SGHIX) | n/a | ★★★ | ★★ | ★★★ | n/a | ★★★ |
% Rank in Category | 25 | 53 | 78 | 45 | n/a | n/a |
Number of Funds in Category | 349 | 336 | 320 | 243 | 148 | 336 |
Saturna Short-Term Bond Fund – "Short-Term Bond" Category | ||||||
(STBFX) | n/a | ★★ | ★★ | ★★ | n/a | ★★ |
% Rank in Category | 97 | 90 | 87 | 88 | 91 | n/a |
Number of Funds in Category | 558 | 529 | 485 | 365 | 241 | 529 |
Saturna Bond Income Fund – "Long-Term Bond" Category | ||||||
(SBIFX) | n/a | ★★★★ | ★★★★ | ★★★ | n/a | ★★★★ |
% Rank in Category | 20 | 20 | 57 | 85 | 100 | n/a |
Number of Funds in Category | 45 | 38 | 35 | 28 | 20 | 38 |
© 2025 Morningstar®. All rights reserved. Morningstar, Inc. is an independent fund performance monitor. The information contained herein: (1) is proprietary to Morningstar and/or its content providers; (2) may not be copied or distributed; and (3) is not warranted to be accurate, complete, or timely. Neither Morningstar nor its content providers are responsible for any damages or losses arising from any use of this information.
A Morningstar Ratings™ (“Star Ratings”) are As of March 31, 2025. The Morningstar Rating™ for funds, or “star rating”, is calculated for managed products (including mutual funds, variable annuity and variable life subaccounts, exchange-traded funds, closed-end funds, and separate accounts) with at least a three-year history. Exchange-traded funds and open-ended mutual funds are considered a single population for comparative purposes. It is calculated based on a Morningstar Risk-Adjusted Return measure that accounts for variation in a managed product’s monthly excess performance (not including the effects of sales charges, loads, and redemption fees), placing more emphasis on downward variations and rewarding consistent performance. The top 10% of products in each product category receive 5 stars, the next 22.5% receive 4 stars, the next 35% receive 3 stars, the next 22.5% receive 2 stars, and the bottom 10% receive 1 star. The Overall Morningstar Rating for a managed product is derived from a weighted average of the performance figures associated with its three-, five-, and 10-year (if applicable) Morningstar Rating metrics. The weights are: 100% three-year rating for 36-59 months of total returns, 60% five-year rating/40% three-year rating for 60-119 months of total returns, and 50% 10-year rating/30% five-year rating/20% three-year rating for 120 or more months of total returns. While the 10-year overall star rating formula seems to give the most weight to the 10-year period, the most recent three-year period actually has the greatest impact because it is included in all three rating periods.
% Rank in Category is the fund’s total return percentile rank for the specified time period relative to all funds that have the same Morningstar category. The highest (or most favorable) percentile rank is 1 and the lowest (or least favorable) percentile rank is 100. The top-performing fund in a category will always receive a rank of 1. Percentile ranks within categories are most useful in those categories that have a large number of funds.
The Saturna Growth and International Funds offer two share classes – Investor Shares and Z Shares, each of which has different expense structures.