Fixed Income Markets Q4 2025 Commentary
Key Market Takeaways
- 2025 delivered strong, broad-based fixed income returns amid a structurally steepening Treasury curve, as Federal Reserve rate cuts pulled down the front end while long yields rose on fiscal and inflation concerns.
- Corporate credit and especially emerging markets debt outperformed, with historically tight spreads and emerging markets boosted by a weaker dollar, early local easing cycles, and robust growth in countries like Brazil and Mexico.
- Late-year “Shadow Quantitative Easing” marked a pivotal shift, as the Fed quietly halted quantitative tightening and injected liquidity via bills, regulatory relief, and an opened-up Standing Repo Facility, stabilizing market plumbing but leaving the system more reliant on ongoing central bank support.
The fixed income markets of 2025 were defined by both tight credit spreads and fragile market plumbing. This culminated in the fourth quarter, which ended with a year of strong returns, structural yield curve steepening, and a pivotal shift in Federal Reserve balance sheet policy. While the year delivered broad-based gains across the bond markets — driven by the long-awaited pivot to interest rate cuts — the fourth quarter witnessed a quiet revolution in monetary operations dubbed “Shadow Quantitative Easing” (Shadow QE), which stabilized fraying liquidity conditions without formally altering the monetary policy stance.
Policy Shifts and the Steepening Treasury Curve
The dominant theme in the last quarter of 2025 was the Federal Reserve’s transition from restriction to calibrated easing. The Fed executed three rate cuts beginning in September, lowering the federal funds rate to a range of 3.50%–3.75% by year-end. The final cut in December proved highly contentious, passing with a 9-3 vote — the highest level of dissent since 2019 — as policymakers wrestled with the dual risks of softening labor markets and sticky, above-target inflation.
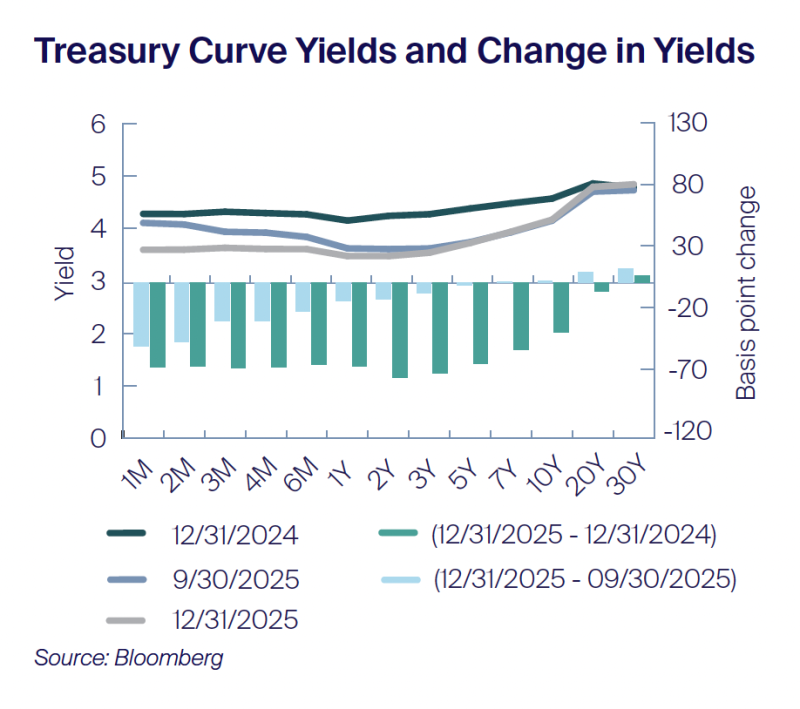
This policy divergence played out against a backdrop of trade volatility. The federal deficit for fiscal year 2025 reached $1.8 trillion, while “Liberation Day” in April — marking President Trump’s announcement of sweeping new tariffs — triggered a massive spike in bond volatility. These forces conspired to drive a structural steepening of the yield curve.
The spread between 2-year and 10-year Treasury yields widened from roughly 20 basis points over the fourth quarter to 70 basis points by year-end. As seen in the accompanying graph, generally yields outside of ten years were anchored, as shorter term yields fell with the Fed’s rate cuts. Yields of 20- and 30-year Treasury bonds increased over the year, with the 30-year rising six basis points in the fourth quarter alone. This suggests broad market caution about the long-term economic outlook. The curve steepening benefited the belly of the curve, with the Bloomberg US Aggregate 5–7- year and 7–10-year indices returning over 8% for 2025.
Credit Markets: Historic Spread Compression, Spotlight on the Emerging Markets
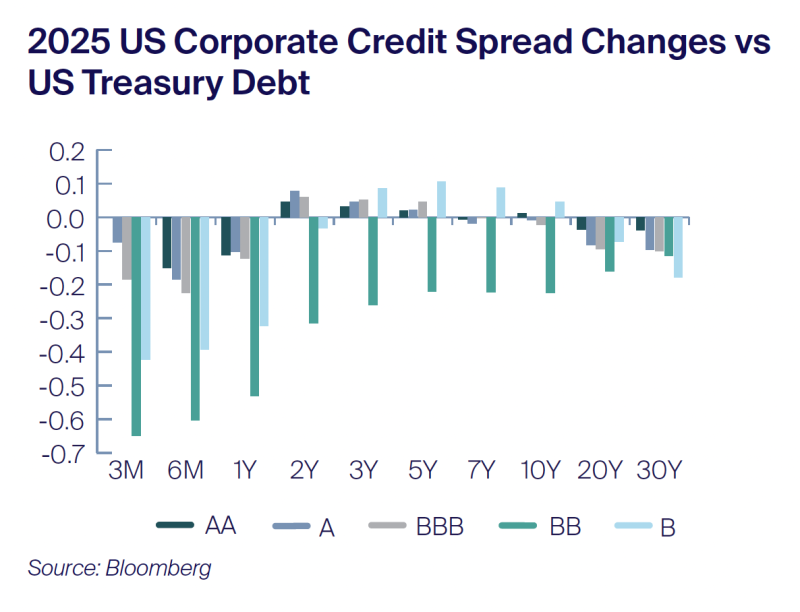
Despite macro volatility, corporate credit markets delivered exceptional performance driven by technical demand and resilient fundamentals. Both Investment-grade and high-yield spreads compressed. Over 2025 BB-rated US corporate bonds saw spread compression across the curve with 22 basis points of tightening in the 10-year maturities over the full year, with six basis points of that in the last quarter.
Emerging markets (EM) debt emerged as the year’s top performer, returning over 11% as measured by the Bloomberg EM USD Aggregate. The asset class benefited from a “Goldilocks” scenario: a weakening US dollar, early easing cycles by EM central banks, and robust growth in key economies like Brazil and Mexico. The Mexican peso appreciated more than 15% relative to the US dollar over the year, driving strong performance of peso-denominated debt.
The Q4 Pivot: The Emergence of Shadow Quantitative Easing
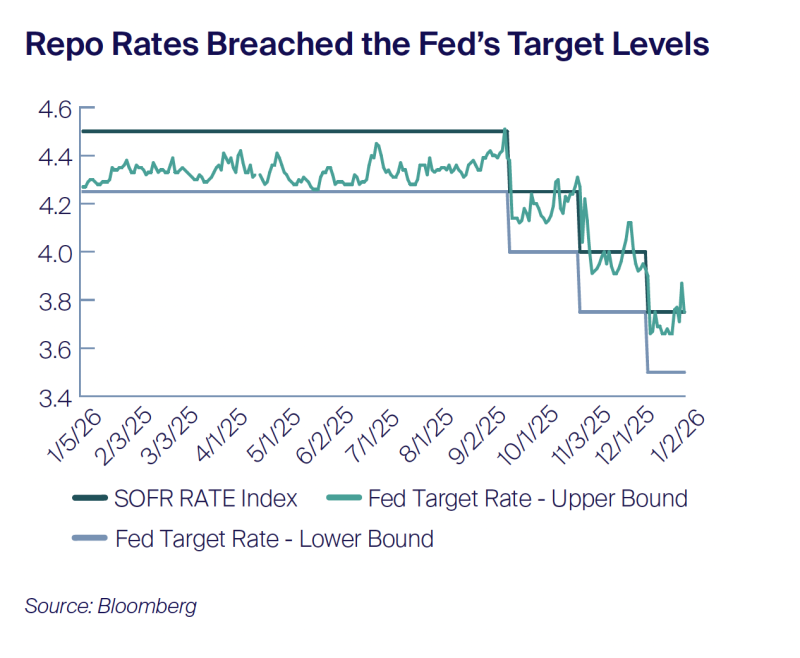
While credit markets saw strong performance, the plumbing of the financial system began to suffer in the fourth quarter. The Federal Reserve’s quantitative tightening (QT) program, which had reduced the balance sheet by over $2 trillion since 2022, finally decreased bank reserves to the lower bound of “ample.” Scarce liquidity in the market can potentially force short-term interest rates up, weakening the Federal Reserve’s control of monetary policy. By October and November, signs of stress appeared. For example, repo rates spiked above the Fed’s target range.
Recognizing that liquidity was becoming perilously scarce, the Fed executed a swift operational pivot in the fourth quarter to inject liquidity into the markets. This involved four distinct mechanisms designed to inject liquidity without formally declaring a return to stimulus:
- The End of QT: On December 1, 2025, the Fed officially halted its balance sheet runoff, transitioning from passive tightening to stabilization.
- Reserve Management Purchases (RMPs): On December 10, the Fed announced it would begin purchasing Treasury bills at a pace of roughly $40 billion per month. Unlike traditional QE, which targets long-term bonds to suppress rates, RMPs focused exclusively on short-term bills to rebuild bank reserves.
- Regulatory and Facility Relief: Regulators finalized reductions in the Supplementary Leverage Ratio (SLR), freeing up bank balance sheet capacity to hold Treasuries. By relaxing capital requirements and adjusting the SLR, the government is encouraging banks to make larger purchase of treasuries, providing liquidity to financial markets, but without a public acknowledgement of QE.
- Standing Repo Facility (SRF) Adjustments: The facility provides overnight loans to banks at a defined rate, protecting the market from large spikes in overnight funding rates due to poor liquidity. In December, the FOMC removed the $500 billion counterparty limit, signaling unlimited capacity and encouraging institutions to use the facility more actively.
Mechanisms and Market Impact
Shadow QE functioned as a technical liquidity injection. By purchasing Treasury bills and encouraging SRF usage, the Fed expanded its balance sheet and injected reserves into the banking system, effectively monetizing a portion of the Treasury’s issuance. SRF usage hit a record $74.6 billion on December 31, proving that the facility had transitioned from a dormant emergency hatch to an active liquidity valve.
Because Reserve Management Purchases targeted bills, front-end yields fell, anchoring the short end of the curve. However, because the Fed was not buying long-term bonds (and term premiums were rising), long-end yields did not collapse. This reinforced the curve steepening trend. The Fed successfully framed these actions as “plumbing” rather than “policy.” Consequently, the market liquidity injection did not trigger a massive risk-on rally or inflationary panic but rather put a floor under asset prices and reduced systemic tail risks.
Going Forward
By the close of 2025, the fixed income landscape in the United States had been structurally altered. The era of excess liquidity was over, replaced by a regime of “active reserve management” where the Fed must maintain a footprint in bill markets to offset government deficits. For investors, the environment heading into 2026 is one of nuance. Credit spreads offer little cushion for error, making security selection paramount, while the steepening yield curve offers renewed opportunities to capture carry and roll-down return.
Shadow QE proved to be the year’s final, critical plot twist — a mechanism that kept the market’s gears turning even as the fiscal burden grew heavier. It validated the fixed income market’s resilience but underscored its increasing dependence on central bank liquidity support to digest the structural supply of US debt.

Important Disclaimers and Disclosures
This publication should not be considered investment, legal, accounting, or tax advice, or a representation that any investment or strategy is suitable or appropriate to a particular investor’s circumstances or otherwise constitutes a personal recommendation to any investor. This material does not form an adequate basis for any investment decision by any reader and Saturna may not have taken any steps to ensure that the securities referred to in this publication are suitable for any particular investor. Saturna will not treat recipients as its customers by virtue of their reading or receiving the publication.
The information in this publication was obtained from sources Saturna believes to be reliable and accurate at the time of publication.
All material presented in this publication, unless specifically indicated otherwise, is under copyright to Saturna. No part of this publication may be altered in any way, copied, or distributed without the prior express written permission of Saturna.