Equity Markets Q4 2025 Commentary
Key Market Takeaways
- After a volatile start to 2025 driven by tariffs and perception of China’s DeepSeek, markets ultimately delivered strong gains, with leadership broadening beyond a handful of mega-cap tech names.
- A weak dollar made international equities standout winners, as developed and emerging markets ETFs returned over 30% in dollar terms, while gold and silver surged to record nominal highs amid debasement concerns.
- Despite three straight years of double-digit returns, history suggests multi-year winning streaks are common, and with fiscal liquidity, potential AI-driven productivity, and no clear constraint from the bond market, the backdrop for equities entering 2026 remains supportive.
2025’s four quarters each provided a unique stock market performance tableau. The first quarter combination of tariff fears under the new administration and the revelation of China’s DeepSeek artificial intelligence (AI) model drove markets down sharply, led by AI-related stocks. DeepSeek appeared to have achieved performance commensurate with US models at a fraction of the cost, while China’s position as America’s most dynamic global competitor exacerbated the effect.
The sell-off continued through April’s “Liberation Day” announcement but a subsequent pivot by the administration toward tariff moderation launched a second quarter market rally, led by the same technology stocks that had suffered earlier. Returns during the quarter resembled those of the previous two years — heavily concentrated among a handful of technology stocks.
Over the summer and through September, the market bucked tradition by maintaining its winning momentum. Of greater interest, performance broadened, encompassing more than just technology and AI-adjacent stocks. During the third quarter, every S&P sector but one appreciated — a surprise since the Federal Reserve stood pat, frozen in the middle of the economic highway like the proverbial deer staring into the headlights of anticipated tariff engendered inflation. Eventually, inflation’s failure to accelerate and growing labor market worries spurred the Fed to make the first of three consecutive 25-basis-point reductions in September.
Despite the cuts, markets lost momentum with lackluster fourth quarter trading. A modest Santa Claus rally peaked on Christmas Eve then failed, with the market declining each day through year end. The S&P 500 Index closed September 30 at 6,688.46 and spent the next three months trading in a range of roughly 6,500–6,900 before finishing the year at 6,845.50, up 2.35% for the quarter. Despite the weak start to the year, the 2025 broad market return of 17.88% stands well above the historical average, as was the case in 2024 and 2023.
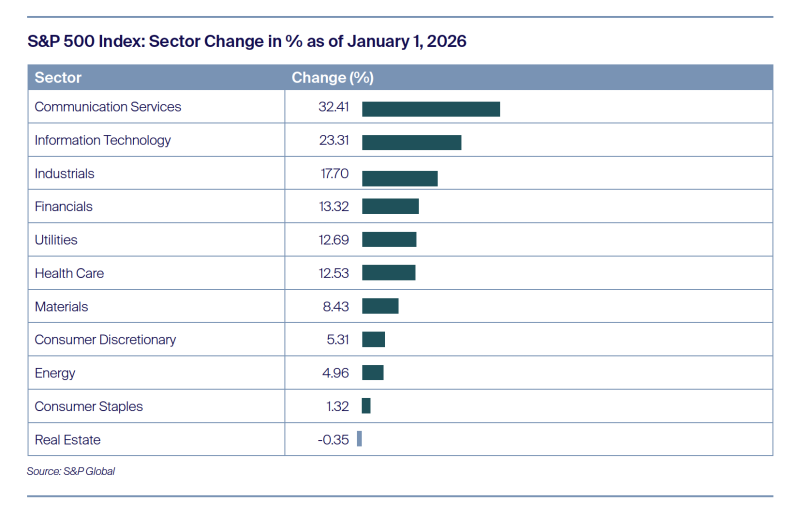
Reviewing performance by sector, we see that Technology relinquished the captain’s chair to Communications but was still the second strongest performing sector. Considering that Communications returns were driven by Alphabet, while Industrials and Utilities rode the coattails of the data center buildout, AI was irrefutably the dominant investment theme of a “risk-on” year. Nonetheless, there was broadening of performance given that all sectors, except for Real Estate, provided a positive return.
For US investors, overseas markets were even more rewarding than home, a departure from the experience of the past several years. USD weakness against many currencies, the Japanese yen being an exception, turbocharged returns for dollar-based investors. In dollar terms, the iShares MSCI EAFE ETF, which measures non-US developed market performance, returned 31.55%, while the iShares MSCI Emerging Markets ETF returned 33.98%. During the year the US Dollar Index (DXY Index), which tracks the dollar’s performance against a basket of currencies, fell 10.08% — its steepest drop since 2017.
Markets that failed to outpace the US were few and far between — Thailand and the Philippines in Southeast Asia, Argentina and Venezuela (neither a surprise) in South America, Denmark and Turkey in Europe. Overseas markets offered attractive valuations compared to the US, a situation that persists as we enter 2026. Of course, the inverse was true for overseas investors measuring their US market returns in British pounds or euros. In 2025, a UK investor in the S&P 500 Index saw a 9.47% return in her local currency, while one based in the euro area experienced a return of only 3.91%.
Equities were not the only asset competing for investor attention. Precious metals featured in the headlines as gold and silver leapt to all-time highs. Gold’s appreciation to $4,314 by year-end surpassed previous peaks even in terms of inflation-adjusted “real” dollars. Silver soared even more than gold but its year end price of $71 remained short of the “real” dollar peak of roughly $170, achieved when the Hunt brothers attempted to corner the market in 1979–80.
While investors can argue over whether AI-related stocks are in a bubble based on expected cash flows and valuations, no such argument can be had over precious metals. Absent future cash flows, net present value cannot be calculated. Gold and silver derive their value from thousands of years of human history and from what they are not: assets based on the full faith and credit of the United States. That distinction and fear of debasement make gold of interest to individual investors and central banks alike. Silver holds less interest for central banks since, at current prices, it takes roughly 61 ounces of silver to equal to one ounce of gold, making it more expensive to transport and store. Regardless, the silver price has a history of trading within a band relative to gold and investors clearly decided at the start of 2025 that it was too cheap. Silver also has more extensive industrial uses, especially in solar power, while the price has been influenced by supply and demand imbalances. There’s no way to predict how long the rally in precious metals may last but, historically speaking, reversals have been violent.
Market Outlook
As fund disclaimers emphasize, past performance is no guarantee of future results. But neither should past performance cause nervousness. With memories of the global financial crisis and the pandemic still fresh in many investors’ minds, some may think that following three consecutive years of double-digit stock market returns1 one should eye the future warily and lock in gains. While we cannot say with any certainty how the market will perform in 2026, we would discourage such notions. Multi-year runs of positive returns are not uncommon. Over the past century there have been seven periods of rising markets continuing for four consecutive years and even instances of the market appreciating for as long as nine consecutive years.
Interestingly, these streaks have become more common over the past 45 years compared to the previous 55. Over eight consecutive years from 1982 through 1989, the market provided a positive return including dividends. Even the crash year of 1987 was up due to pre-October gains. The 1990s looked at that and said, “We can do you one better,” with the market rising for nine straight years from 1991 through 1999. The 2000s started poorly with three consecutive down years before reeling off five straight up years that came to an ignominious end with the Global Financial Crisis in 2008. Only a year later, however, we embarked on another nine-year win streak with positive returns every year from 2009 through 2017. As legendary investor Peter Lynch said, “Far more money has been lost by investors preparing for corrections, or trying to anticipate corrections, than has been lost in corrections themselves.”
Apart from the avoidance of depression and world war that plagued the first decades of the past century, policy makers may have learned something over time, leading to better management of the economy and a more stable environment for corporate earnings to expand. Of course, the last 45 years mark the rise of the information technology revolution, which may be experiencing a step-change with the development of AI. Nor should we ignore the reality that US government debt has soared since the Reagan administration, providing ample fuel for asset-based rallies. According to the Federal Reserve, total public debt as a percentage of gross domestic product has increased from 31% at the end of 1980 to 119% at the end of the second quarter of this year. Additional stimulus from the tax bill passed last summer and the likelihood of further government debt increases given the absence of protests from the bond market, imply a continuing liquidity tailwind to support asset prices. If we’re lucky and artificial intelligence has the productivity enhancing benefits that supporters tout, economic expansion could even address the debt burden and set the market up to challenge the longevity of previous winning streaks.
About the Author

Important Disclaimers and Disclosures
This publication should not be considered investment, legal, accounting, or tax advice, or a representation that any investment or strategy is suitable or appropriate to a particular investor’s circumstances or otherwise constitutes a personal recommendation to any investor. This material does not form an adequate basis for any investment decision by any reader and Saturna may not have taken any steps to ensure that the securities referred to in this publication are suitable for any particular investor. Saturna will not treat recipients as its customers by virtue of their reading or receiving the publication.
The information in this publication was obtained from sources Saturna believes to be reliable and accurate at the time of publication. All material presented in this publication, unless specifically indicated otherwise, is under copyright to Saturna. No part of this publication may be altered in any way, copied, or distributed without the prior express written permission of Saturna.
The State Street® SPDR® Portfolio S&P 500® ETF seeks to provide investment results that, before fees and expenses, correspond generally to the total return performance of the S&P 500® Index (the “Index”). A low-cost ETF that seeks to offer precise, comprehensive exposure to the US large cap market segment. The Index represents approximately 80% of the US market.
The S&P 500® Index is designed to measure the performance of the large-cap segment of the US equity market. It is float-adjusted market capitalization weighted.
The iShares MSCI EAFE ETF seeks to track the investment results of an index composed of large- and mid-capitalization developed market equities, excluding the U.S. and Canada.
The iShares MSCI Emerging Markets ETF seeks to track the investment results of an index composed of large- and mid-capitalization emerging market equities.
The DXY Index, or U.S. Dollar Index, measures the U.S. dollar’s strength against a basket of six major foreign currencies (Euro, Yen, Pound, Canadian Dollar, Swedish Krona, Swiss Franc).
1 Using the S&P 500 Index as a proxy for the market.