Amana Mutual Funds Quarterly Commentary - Q4 2024
Another year of strong positive US equity market returns has entered the books with the S&P 500 Index gaining 25.02% and the Nasdaq Composite Index rising 29.60% for the full year ended December 31, 2024. Overseas markets were less ebullient as the STOXX Europe 600 Index gained 9.48% in euros and Japan’s Topix Index rose 20.45% in Japanese yen. A strengthening US dollar meant that for dollar-based investors the overseas returns were a more modest at 2.75% and 8.0% respectively. Finally, emerging markets returned 6.50%.
In the realms of economic performance, stock market returns, and currency strength, American exceptionalism has been on display, driven by the country’s considerable lead in technological innovation and the commercialization of breakthroughs. Nobody disputes Taiwan Semiconductor’s dominant position in semiconductor manufacturing or Netherlands-based ASML’s leadership in semiconductor lithography, but no other country has leveraged those tools more successfully than the United States in chip design, product innovation, and pioneering new uses cases, such as artificial intelligence (AI). This leadership has resulted in the US market’s unique concentration of mega-capitalization companies, which have been instrumental in propelling US index performance in recent years.
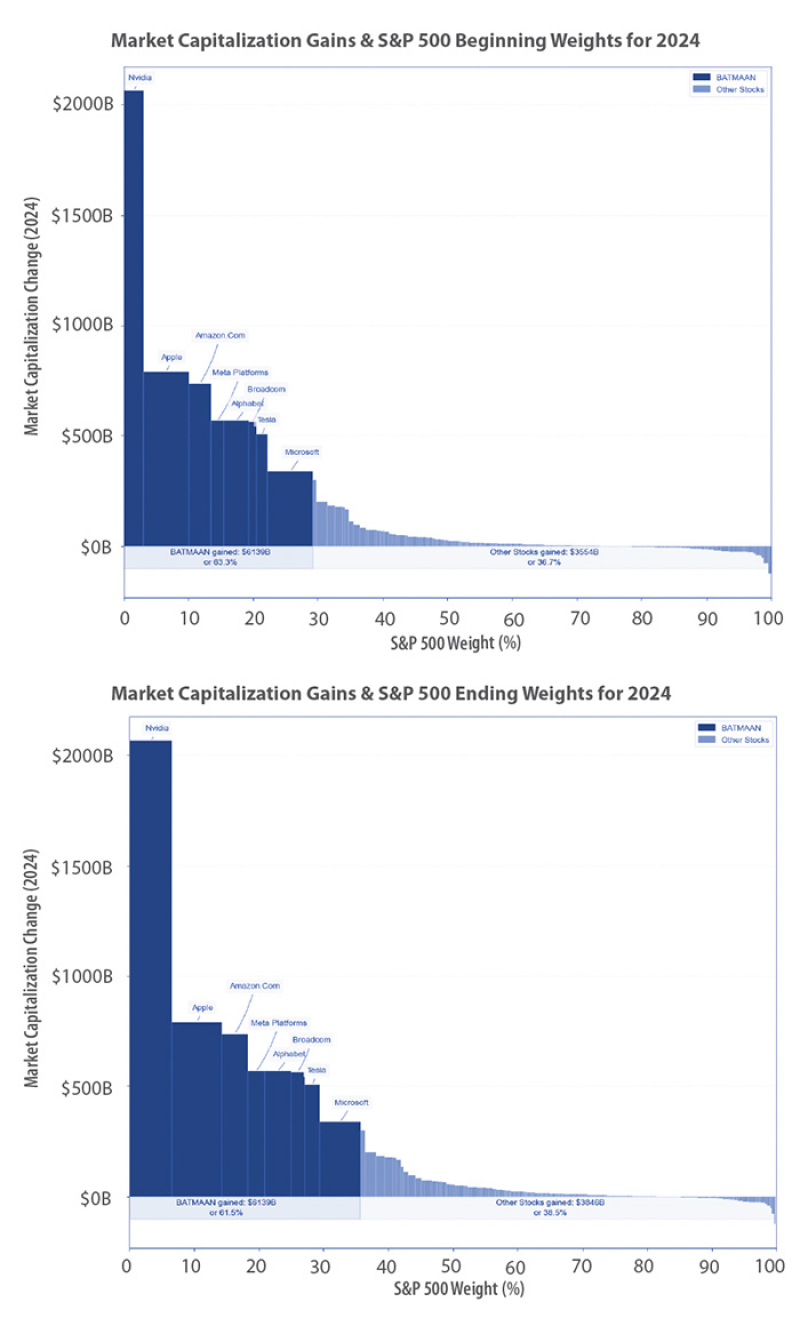
Of the ten largest market capitalization companies in the world, eight are American, with only Saudi Aramco (No. 6) and Taiwan Semiconductor (No. 10) making the cut. Moving further down the list China’s Tencent appears at No. 16, and Denmark’s Novo Nordisk at No. 25. Said another way, 21 of the 25 largest companies in the world by market capitalization are American. Of course, the top 25 encompasses far more than technology, with Berkshire Hathaway, Eli Lilly, Walmart, Visa, Mastercard, Costco, Proctor & Gamble, and others also included.
That said, while others may be playing in the same sandbox, market returns unequivocally demonstrate who are the cool kids, as we see in the charts. In the first chart the width of the bars represents the stock’s weight in the S&P 500 Index at the start of the year. In the second chart, we show the weight at year end. Concentration of returns has been the dominant topic for the past 18 months, ever since Nvidia’s May 2023 earnings announcement. Rather than further rehashing mega-cap market concentration issues that have been thoroughly dissected, we turn our thoughts to the future.
Outlook
Over the past 97 years (starting in 1928), the S&P 500 Index has achieved an annualized nominal return of 6.12%. The figure does not include dividends and the ability to re-invest dividends, which gives us the total return. On that basis, the compound annual growth rate of returns comes to just over 10%1 and at that rate an investment doubles in value every eight years, providing a positive real return after inflation. Keep in mind, the past 97 years includes the Great Depression, World War II, the stagflation of the 1970s, and the global financial crisis of 2007–2009 to name a few of the more disruptive events. Over the past ten years, the Iindex has achieved a total return of 13.12% and a whopping 14.61% annualized over the past five. At that pace, it takes just over five years for an investment to double in value.
Clearly the stock market has been good to retiring baby boomers. Will Gen X, millennials, and Gen Y fare as well? We believe the long-term answer to be yes and consider the 97-year 6.16% index return a bear case expectation given the social, political, and economic gyrations that accompanied it. Perhaps we’re overly sanguine about the next 100 years but the 20th century was a tough one. That market performance has been driven by the innovation and resilience of the US economy and, as previously discussed, we expect that to continue. Today’s high starting point may moderate returns on a five-year basis but consider how high the starting point was in 1928, the year prior to the stock market crash of 1929. Stock market returns are not, in the short run, correlated with economic performance but, as the history of US stock market returns demonstrates, there is a solid long-term relationship.
For 2025, there are various positive and negative crosscurrents. Returns over the past two years have pushed valuations to worryingly high levels. An initial positive market reaction to Donald Trump’s victory in the presidential election has given way to directionless trading and the S&P 500 Index finished the year less than 2% higher than the day prior to the election. Some of the president-elect’s policy prescriptions have raised eyebrows, such as tariffs, the elimination of taxes on tips, overtime, and Social Security, and a Bitcoin “strategic reserve.” Others, including corporate income tax rate cuts and a reduced regulatory burden have been applauded.
It’s likely that the failure of the market to rally in the wake of Trump’s victory has less than to do with possible future policies than with the Federal Reserve’s admission that they may have moved ahead of the curve in terms of rate reductions and would put future cuts on hold as they assess economic strength and inflationary resilience. Confusingly, these sentiments were communicated in tandem with a 25-basis point (bps) cut.
Separating the signal from the noise challenges investors in the best of times but becomes more difficult with an incoming administration featuring a strikingly different agenda from the outgoing team. That said, we believe there is one predictable event that will set the tone for the first months of the administration — keeping the government funded.
The risks came to the fore sooner than we anticipated with social media messages from Elon Musk and the president-elect torpedoing a bipartisan agreement to keep the government funded through March. Subsequent demands by the president-elect to eliminate the debt ceiling were rebuffed. While a third attempt to keep the government open succeeded, it’s only until March. The fact that 38 Republicans voted against the incoming president’s desire for an elimination of the debt ceiling demonstrates that the next round of negotiations are likely to provide fireworks and involve brinksmanship. How far the debt vigilantes are willing to go remains to be seen.
Meanwhile, the fuse has already been lit by outgoing Treasury Secretary Janet Yellen who stated to Congress that absent an agreement to raise or suspend the debt ceiling, the Treasury will have to start implementing “extraordinary measures” as soon as January 14. The debt ceiling was suspended during negotiations in 2023, but that expired with the new year.
However, we make no predictions about how any of these events will play out, nor their effects on the stock market. It’s important to note that market returns are not linear and there is a vanishingly small likelihood of adding value through market timing.
Amana Income Fund
In the fourth quarter of 2024, Amana Income Fund Investor Shares returned -3.41% and the Institutional Shares returned -3.34%. The S&P 500 Index returned 2.41% over the same period. For the 2024 calendar year, Amana Income Investor Shares returned 12.88% and the Institutional Shares returned 13.16%. The calendar-year return for the S&P 500 Index was 25.02%.
The major fourth-quarter event was the re-election of Donald Trump as president, after one term out of office. Trump’s return to power was the latest in a succession of major losses for incumbent parties in developed countries. The reaction to his victory was positive for US equities but negative for international stocks, where investors may fear a more confrontational approach to trade (tariffs) and less geopolitical cooperation.
The Fund’s top performers in the fourth quarter included Taiwan Semiconductor and Broadcom. Broadcom and Taiwan Semiconductor both had a great quarter and were the top performers of the fund in 2024 due to their impressive outlook for AI growth. Taiwan Semiconductor has been owned in the fund for several years and Broadcom was bought before the AI story become popular. Johnson Controls was another standout, benefitting from the Inflation Reduction Act.
The Fund’s biggest detractors during the quarter included Eli Lilly and Genuine Parts. Eli Lily suffered from profit-taking as it was a top performer year-to-date. The fund has a sizeable position in the company as its GLP-1 drugs are in demand. This might last a few years, but competition is increasing. We have begun to reduce our position, albeit slowly.
Outlook
As the incoming administration takes over, we look forward to getting better visibility into how the myriad and sometimes competing pledges of Trump and his congressional allies get prioritized into a governing agenda. Longer-term, the US technology sector is collectively investing an enormous sum into AI infrastructure and investors will be keen to see whether these investments are backed up by continued progress and financial returns.
As of December 31, 2024
| 10 Largest Contributors YTD | Return | Contribution |
| Taiwan Semiconductor, ADR | 92.56% | 4.56 |
| Eli Lilly | 33.30% | 4.43 |
| Broadcom | 110.43% | 2.01 |
| Microsoft | 12.92% | 1.15 |
| W.W. Grainger | 28.21% | 1.07 |
| Johnson Controls | 39.79% | 0.69 |
| Eaton Corp | 39.52% | 0.57 |
| Cisco Systems | 20.99% | 0.41 |
| Colgate-Palmolive | 16.56% | 0.36 |
| Nintendo | 15.28% | 0.33 |
| 10 Largest Detractors YTD | Return | Contribution |
| PPG Industries | -18.46% | -0.62 |
| Canadian National Railway | -17.50% | -0.46 |
| Rockwell Automation | -6.23% | -0.42 |
| United Parcel Service, Class B | -15.98% | -0.35 |
| Genuine Parts | -13.21% | -0.34 |
| Ferguson Enterprises | -6.12% | -0.25 |
| Merck & Co | -18.53% | -0.16 |
| Honeywell International | -3.75% | -0.15 |
| Amgen | -6.76% | -0.1 |
| Illinois Tool Works | -0.98% | -0.09 |
| Top 10 Holdings | Portfolio Weight |
| Eli Lilly | 12.11% |
| Microsoft | 8.83% |
| Taiwan Semiconductor, ADS | 8.53% |
| Rockwell Automation | 4.49% |
| W.W. Grainger | 4.42% |
| Illinois Tool Works | 3.99% |
| Broadcom | 3.64% |
| Linde | 2.85% |
| Texas Instruments | 2.46% |
| PPG Industries | 2.37% |
| 30-Day Yield | |
| Investor Shares (AMANX): | 0.71% |
| Institutional Shares (AMINX): | 0.95% |
Asset-weighted average debt to market cap: 11.3%
Amana Growth Fund
The Amana Growth Fund experienced a difficult fourth quarter and full year ended December 31, 2024, due to the inability to fully participate in the index-driving returns of the mega-cap technology stocks, a significantly overweight exposure to the underperforming Health Care sector, and investments in a handful of diverse, poorly performing stocks. In the fourth quarter of 2024, the Amana Growth Fund Investor shares declined -1.80% against a 2.41% total return for the S&P 500 Index. For the same period, the Amana Growth Fund Institutional shares were -1.73%. The Amana Growth Fund Investor shares full-year 2024 return of 15.75% was well behind the S&P 500 Index return of 25.02%. For the same period, Amana Growth Fund Institutional shares returned 16.02%. We are hopeful that 2026 will bring a more balanced return profile for the overall market, rather than the concentrated domination we have seen the past two years.
Among the top ten contributors to Fund returns for the year, Nvidia, Apple, and Alphabet are all members of the Magnificent Seven. We also hold Microsoft, although its 2024 returns were modest. Not every Magnificent Seven stock is available to us for investment. Due to haram activities, we cannot purchase Amazon. We have avoided Tesla for speculative and governance reasons, while governance has been our primary objection to Meta. All three of those stocks performed exceptionally well last year. Fortunately, we were invested in several companies that enjoyed stellar 2024 performances, including semiconductor/software hybrid Broadcom, global semiconductor foundry behemoth Taiwan Semiconductor, database giant Oracle, business software provider ServiceNow and HVAC/cooling companies Trane and Johnson Controls.
Broadcom, in particular, burst through in December with results and an outlook that sent the shares over 38% higher in two days. Although fully half of our top ten contributors were, on one hand, non-Magnificent Seven stocks and, on the other, appreciated by over 50%, their weights in the Fund could not match the weights of the mega-cap companies in the benchmark.
Retail, Software, Hardware, Pharmaceuticals, and Industrials were all represented among 2024’s weakest performers. Canadian apparel company Lululemon and media software leader Adobe were the weakest by far. Lululemon round-tripped a strong 2023 performance as sales growth in North America hit a wall. While the stock has rebounded considerably from the nadir, we decided to exit the position to realize capital losses that could be used to defray capital gains tax. Adobe has suffered from an extended valuation, which has now normalized, while it looks set to be one of the beneficiaries of AI. We exited health insurer Elevance on concerns surrounding the US medical insurance industry, veterinary test equipment leader IDEXX on valuation, and Amgen as acquisition activity pushed debt well above acceptable levels. We remain positive on the long-term operational outlook for the others.
Novo Nordisk has been an outstanding performer for the Fund for nearly 30 years. We expect those days to return. Nvidia has gotten a jump on Advanced Micro Devices but companies are wary of being reliant on only one vendor and AI will be big enough for more than one chip supplier. AbbVie’s Humira headwind has come to an end and the company will return to solid earnings growth this year on an attractive valuation. The divergence in performance between Taiwan Semiconductor and ASML was somewhat unusual as the latter is the primary supplier to the former and we expect a stronger 2025.
As of December 31, 2024
| 10 Largest Contributors YTD | Return | Contribution |
| Broadcom | 110.43% | 2.92 |
| Nvidia | 178.87% | 2.44 |
| Taiwan Semiconductor, ADR | 92.55% | 2.42 |
| Apple | 30.70% | 2.27 |
| Eli Lilly | 33.30% | 1.64 |
| Alphabet, Class A | 36.01% | 1.36 |
| ServiceNow | 50.05% | 1.25 |
| Oracle | 59.99% | 1.15 |
| Trane Technologies | 52.97% | 1.09 |
| Johnson Controls | 39.79% | 0.8 |
| 10 Largest Detractors YTD | Return | Contribution |
| Lululemon Athletica | -41.69% | -1.00 |
| Adobe | -25.46% | -0.98 |
| Advanced Micro Devices | -18.06% | -0.49 |
| Novo Nordisk, ADR | -15.93% | -0.43 |
| Elevance Health | -13.84% | -0.23 |
| Idexx Laboratories | -15.65% | -0.20 |
| Lincoln Electric Holdings | -12.56% | -0.15 |
| Abbvie | -7.61% | -0.15 |
| ASML Holding NY | -7.70% | -0.11 |
| Amgen | -5.53% | -0.10 |
| Top 10 Holdings | Portfolio Weight |
| Apple | 8.90% |
| Nvidia | 5.08% |
| Microsoft | 5.01% |
| Broadcom | 4.80% |
| Alphabet, Class A | 4.59% |
| Eli Lilly | 4.44% |
| Taiwan Semiconductor ADS | 4.31% |
| ASML Holding NY | 3.84% |
| ServiceNow | 3.53% |
| Intuit | 3.23% |
Asset-weighted average debt to market cap: 7.6%
Amana Developing World Fund
For the quarter ended December 31, 2024, Amana Developing World Fund Investor Shares total return was -6.91%, outperforming the MSCI Emerging Markets Index, which was -8.01%. The Institutional Shares of the Fund returned -6.89% in the same period. In the full year ended December 31, 2024, Investor Shares were up 6.93% compared to 7.50% for the MSCI Emerging Markets Index. The Institutional Shares of the Fund returned 7.22% in the same period.
In the fourth quarter of 2024, the Fund underperformed its Morningstar peer group “Diversified Emerging Markets,” which was -6.85% but maintained its year-to-date leadership, with the peer group returning 6.04% during the same period. The Fund continues to receive four stars for its overall performance from Morningstar as of December 31, 2024.
Technology stocks represented six of the 10 largest contributors to the Amana Developing World Fund for the fourth quarter of 2024. Beyond Technology, a host of industries including Consumer Staples, Consumer Discretionary, and Materials were represented among the top contributors. In many ways, this was in line with full-year results where four out of the top 10 contributors were Technology companies and a diverse selection of industries made up the remainder.
In 2024, Nvidia’s 171.25% return contributed an impressive 643bps to the Fund’s performance. Nvidia and its leading-edge semiconductors are fundamental to the generative AI revolution that has taken markets by storm. Taiwan Semiconductor, a key manufacturer of Nvidia chips, was another important contributor to the Fund’s year-to-date performance with a 92.56% return. Importantly, not all the Fund’s performance relates to AI. BIM, a discount Turkish grocer was the fund’s third largest contributor in 2024 showing that even in high inflation environments, grocers can retain pricing power.
The Fund’s largest detractors were dispersed across sectors and geographies. During the fourth quarter of 2024, Consumer Staples, Technology, Health Care, Materials, and Industrials were all represented among the largest detractors. For the full year, detractors were similarly varied with positions in the Consumer Staples, Technology, Consumer Discretionary, Telecommunications, and Health Care sectors represented. KCE Electronics was the weakest performer for the year with a 53.79% loss. The Thai company, one of the world’s top 10 automotive printed circuit board manufacturers, suffered from the headwinds facing European auto manufacturers. While 2024 was a tough year for KCE, we understand this is a cyclical industry and expect auto demand will get back on the road in the years ahead.
In the commentary for the third quarter of 2024, we questioned whether the Federal Reserve’s cutting cycle would induce dollar weaking. Instead, the dollar strengthened by a robust 7.65% in the fourth quarter, highlighting the perilous journey of forecasting foreign exchange rates.
Looking to 2025 and beyond, where the dollar goes is anyone’s guess — but attractive valuations in emerging markets keep us excited about their potential returns. As of November 29, 2024, the MSCI Emerging Markets Index traded at a 11.91x forward price-earnings ratio2 versus 21.91x for the MSCI US Index.3 While we acknowledge valuations are a poor tool for timing the market, attractive prices combined with ascending middle classes and quality companies across diverse sectors, has us maintaining a view of opportunities on the horizon.
As of December 31, 2024
| 10 Largest Contributors YTD | Return | Contribution |
| Nvidia | 171.25% | 6.43 |
| Taiwan Semiconductor, ADR | 92.56% | 2.23 |
| BIM Birlesik Magazalar A.S. | 49.69% | 1.08 |
| KPJ Healthcare Berhad | 76.98% | 0.96 |
| Delta Electronics | 30.44% | 0.70 |
| Hartalega Holdings Bhd | 54.89% | 0.68 |
| Manila Electric Company | 23.45% | 0.62 |
| Unilever, ADR | 20.91% | 0.56 |
| Infosy, ADR | 23.03% | 0.54 |
| IHH Healthcare Bhd | 26.29% | 0.48 |
| 10 Largest Detractors YTD | Return | Contribution |
| KCE Electronics | -53.79% | -1.32 |
| Samsung Electronics | -39.91% | -1.25 |
| Samsung SDI | -54.18% | -1.21 |
| Quimica Y Minera, ADR | -39.34% | -0.91 |
| Unicharm | -30.53% | -0.75 |
| Kimberly-Clark De Mexico, Class A | -33.51% | -0.65 |
| Telkom Indonesia Persero, ADR | -32.42% | -0.62 |
| Wilcon Depot | -33.59% | -0.57 |
| Rio Tinto, ADR | -15.44% | -0.43 |
| Fleury S/A | -22.51% | -0.41 |
| Top 10 Holdings | Portfolio Weight |
| Nvidia | 9.43% |
| Taiwan Semiconductor, ADS | 3.99% |
| Jabil | 3.06% |
| Delta Electronics | 2.99% |
| BIM Birlesik Magazalar A.S. | 2.94% |
| UltraTech Cement | 2.88% |
| Weg S/A | 2.87% |
| Clicks Group | 2.82% |
| Qualcomm | 2.80% |
| Unilever ADS | 2.74% |
Asset-weighted average debt to market cap: 10.5%
Amana Participation Fund
Warren Buffett’s well-known quote, “Price is what you pay. Value is what you get,” is often used to highlight the distinction between the cost of an investment and its intrinsic value. Buffett’s quote offers valued wisdom for discerning investors, as examining just the price of something can reveal valuable information.
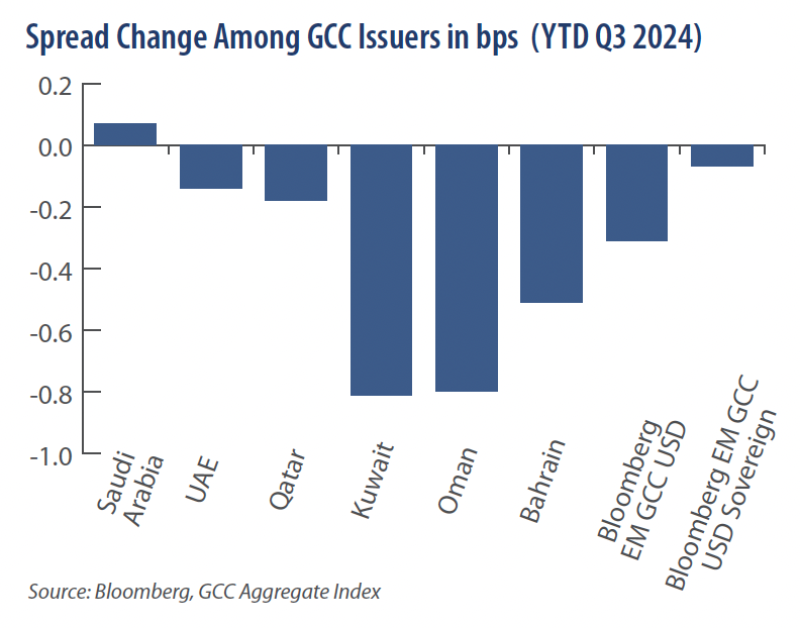
Such a case can be observed in the price action of Saudi Arabia’s fixed income securities compared to the security prices of its Middle Eastern neighbors. By the end of the third quarter, the spreads on Saudi Arabia’s fixed income securities widened by 7bps while the rest of the region’s sovereign issuers experienced tightening. Such divergence among peers imparts an important signal that is captured in the following chart. Countries with lower credit ratings than Saudi Arabia’s A+ rating from Fitch4 such as Bahrain and Oman, rated B+5 and BB+,6 experienced tightening due to investor demand that caused valuations to squeeze in by 51bps and 80bps, respectively.
Apparently, wise investors were expecting something may be afoul. A combination of weak economic growth and other factors affected Saudi Arabia's growth prospects throughout 2024. Hindering the kingdom’s growth prospects was an overabundance of oil coupled with lower oil prices. This led the kingdom’s government to revise its fiscal status and economic prognosis during the fourth quarter of 2024.
Although the kingdom's changes to its main economic projections were mostly expected, investors were taken aback by the size of the shift when it was published on October 22, 2024. The accompanying table shows that the Saudi government revised its 2024 gross domestic product (GDP) forecast from a robust 4.4% to 0.8%. This 360bps revision reflected an adjustment of its own growth assumption by more than 80%. Alongside the GDP adjustments, the kingdom raised its fiscal deficit projections by more than 50% from its initial forecast for a fiscal deficit of -1.9% to -2.9%.7

The kingdom’s revisions are likely to garner investors’ attention for the upcoming year. It is evident that GDP prospects, fiscal spending, energy consumption, and oil prices will receive consideration. Although prudence is justified, worry is not. The region’s efforts to diversify away from its hydrocarbon dependency has gained traction. For example, by year-end 2023, the kingdom’s non-oil sector reached 50% of GDP for the first time, marking a significant milestone in the country’s economic diversification efforts.8
Overall, the region remains well-positioned relative to the world given its favorable progression to diversify away from its hydrocarbon plans and low debt metrics relative to other regions.
Amana Participation Fund – Fourth Quarter Results
As of year-end December 31, 2024, the Amana Participation Institutional Fund shares and Amana Participation Investor Fund shares returned 4.00% and 3.75%, respectively. This is compared to the FTSE Sukuk IdealRatings Index, which returned 3.34% for the same period.
For the trailing three years, the Amana Participation Institutional Fund shares provided an annualized return of 0.58% with the Amana Participation Investor Fund shares returning 0.33%. This is compared to the FTSE IdealRatings Sukuk Index, which returned 0.07% for the same period.
The Amana Participation Fund’s outperformance can be attributed, in part, to our active management that seeks to conservatively position the portfolio among issuers characterized as having robust balance sheets, strong credit ratings, and resilient cash flows led by experienced and prudent management teams. The performance differences relative to the benchmark can also be attributed, in part, to differences in the composition of the benchmark relative to the Fund. Details of these differences can be found in previous quarterly reports and in the white paper, “Behind the Scenes: A Closer Look at the Amana Participation Fund Investment Process, 2nd Edition.”9 We encourage our readers to check out this white paper as it offers important information about the Fund.
At the end of 2024’s fourth quarter, the Amana Participation Institutional Fund shares provided a SEC 30-day yield of 2.79% with the Amana Participation Investor Fund shares offering a SEC 30-day yield of 2.59%. The Amana Participation Fund reported an effective duration of 4.55 years. The Fund is diversified among 46 securities, excluding cash, to meet its investment objective of capital preservation and current income while being entirely invested in US dollar-denominated securities.
The top two performing issues during the fourth quarter of 2024 include real estate operator Emirates REIT and Riyad Bank’s sukuk posting a return of 2.44% and 1.31%, respectively. For the same period, the two worst-performing issues were Indonesian sovereign sukuk followed by Malaysian sovereign sukuk experiencing a return of -8.90% and -6.13%, respectively.
As of December 31, 2024
| Top 10 Holdings YTD | Portfolio Weight |
| KFH Tier 1 Sukuk | 4.46% |
| Riyad Sukuk Limited | 3.64% |
| DP World Salaam | 3.63% |
| DAE Sukuk | 3.54% |
| Dar Al-Arkan Sukuk | 3.38% |
| Air Lease Corp Sukuk | 3.09% |
| SA Global Sukuk | 3.04% |
| EMAAR Sukuk | 3.02% |
| TNB Global Ventures | 2.93% |
| TNB Global Ventures Cap | 2.79% |
| 30-Day Yield | |
| Investor Shares (AMAPX): | 2.59% |
| Institutional Shares (AMIPX): | 2.79% |
Endnotes to Commentary
1 Levy, A. S&P 500 Annual Returns. The Motley Fool. July 29, 2024. https://www.fool.com/investing/stock-market/indexes/sp-500/annual-returns/
2 Fitch Affirms Saudi Aramco at 'A+'; Outlook Stable. Fitch Ratings. December 9, 2024. https://www.fitchratings.com/research/corporate-finance/fitch-affirms-saudi-aramco-at-a-outlook-stable-09-12-2024
3 Fitch Affirms Bahrain at 'B+'; Outlook Stable. Fitch Ratings. March 5, 2024. https://www.fitchratings.com/research/sovereigns/fitch-affirms-bahrain-at-b-outlook-stable-05-03-2024
4 Fitch Revises Oman's Outlook to Positive; Affirms at 'BB+'. Fitch Ratings. December 18, 2024. https://www.fitchratings.com/research/sovereigns/fitch-revises-oman-outlook-to-positive-affirms-at-bb-18-12-2024
5 Turak, N. Saudi Arabia slashes growth forecasts, sees wider budget deficits. CNBC. October 1, 2024. https://www.cnbc.com/2024/10/01/saudi-arabia-slashes-growth-forecasts-sees-wider-budget-deficits.html
6 MSCI Emerging Markets Index (USD). MSCI. December 31, 2024.
7 MSCI USA Index (USD). MSCI. December 31, 2024. https://www.msci.com/documents/10199/67a768a1-71d0-4bd0-8d7e-f7b53e8d0d9f
8 Aplin, L. Saudi Arabia Hits Milestone In Shift Away From Oil Economy. Global Finance. April 2, 2024. https://gfmag.com/economics-policy-regulation/saudi-arabia-milestone-shift-oil-green-transition/
9 A Closer Look at the Amana Participation Fund Investment Process, 2nd Edition. Saturna Capital. June 2024. https://www.saturna.com/sites/saturna.com/files/files/WP-2024_06-AMAPX-Investment-Process-2ndED-web.pdf
Performance Summary
As of December 31, 2024
| Average Annual Total Returns (before taxes, net of fees) | YTD | 1 Year | 3 Year | 5 Year | 10 Year | 15 Year | Expense RatioA |
| Income Fund Investor Shares (AMANX) | 12.88% | 12.88% | 5.37% | 10.31% | 9.62% | 10.46% | 1.01% |
| Income Fund Institutional Shares (AMINX) | 13.16% | 13.16% | 5.62% | 10.55% | 9.88% | n/a | 0.76% |
| S&P 500 Index | 25.02% | 25.02% | 8.93% | 14.51% | 13.09% | 13.87% | n/a |
| Morningstar "Large Blend" Category | 21.45% | 21.45% | 7.24% | 12.89% | 11.57% | 12.57% | n/a |
| Growth Fund Investor Shares (AMAGX) | 15.75% | 15.75% | 5.43% | 15.42% | 14.46% | 13.67% | 0.87% |
| Growth Fund Institutional Shares (AMIGX) | 16.02% | 16.02% | 5.69% | 15.70% | 14.73% | n/a | 0.62% |
| S&P 500 Index | 25.02% | 25.02% | 8.93% | 14.51% | 13.09% | 13.87% | n/a |
| Morningstar "Large Growth" Category | 28.96% | 28.96% | 6.74% | 15.42% | 14.02% | 14.17% | n/a |
| Developing World Fund Investor Shares (AMDWX) | 6.93% | 6.93% | -0.07% | 5.36% | 2.84% | 2.14% | 1.20% |
| Developing World Fund Institutional Shares (AMIDX) | 7.22% | 7.22% | 0.12% | 5.58% | 3.06% | n/a | 0.98% |
| MSCI Emerging Markets Index | 7.50% | 7.50% | -1.92% | 1.70% | 3.63% | 3.01% | n/a |
| Morningstar "Diversified Emerging Markets" Category | 6.04% | 6.04% | -2.04% | 2.26% | 3.55% | 3.14% | n/a |
| Participation Fund Investor Shares (AMAPX) | 3.75% | 3.75% | 0.33% | 1.35% | n/a | n/a | 0.83% |
| Participation Fund Institutional Shares (AMIPX) | 4.00% | 4.00% | 0.58% | 1.57% | n/a | n/a | 0.58% |
| FTSE IdealRatings Sukuk Index | 3.34% | 3.34% | 0.07% | 1.96% | 3.04% | 3.97% | n/a |
| Morningstar "Emerging Markets Bond" Category | 6.92% | 6.92% | 0.37% | 0.77% | 2.97% | 3.87% | n/a |
A Expense ratios shown are as stated in the Funds’ most recent Prospectus dated September 27, 2024.
Performance data quoted represents past performance, is before any taxes payable by shareowners, and is no guarantee of future results. Current performance may be higher or lower than that stated herein. Performance current to the most recent month-end is available by calling toll-free 1-800-728-8762 or visiting www.amanafunds.com. Average annual total returns are historical and include change in share value as well as reinvestment of dividends and capital gains, if any. The investment return and principal value of an investment will fluctuate so that an investor’s shares, when redeemed, may be worth more or less than their original cost. Shares of a Fund may only be offered for sale through the Fund’s prospectus or summary prospectus.
The S&P 500 is an index comprised of 500 widely held common stocks considered to be representative of the US stock market in general. The S&P 500 Equal Weight Index (EWI) is the equal-weight version of the widely-used S&P 500. The index includes the same constituents as the capitalization weighted S&P 500, but each company in the S&P 500 EWI is allocated a fixed weight - or 0.2% of the index total at each quarterly rebalance.
The MSCI Emerging Markets Index, produced by Morgan Stanley Capital International, measures equity market performance in over 20 emerging market countries. The FTSE IdealRatings Sukuk Index measures the performance of global Islamic fixed-income securities, also known as sukuk. When available, Saturna uses total return components of indices mentioned. Investors cannot invest directly in the indices.
Institutional Shares of the Amana Funds began operations September 25, 2013. The Amana Participation Fund began operations September 28, 2015.
Income, Growth, Developing World, and Participation Funds: The value of the shares of each of the Funds rises and falls as the value of the securities in which the Funds invest goes up and down. The Amana Mutual Funds limit the securities they purchase to those consistent with Islamic principles. This limits opportunities and may affect performance. Each of the Funds may invest in securities that are not traded in the United States. Investments in the securities of foreign issuers may involve risks in addition to those normally associated with investments in the securities of US issuers. These risks include currency and market fluctuations and political or social instability. The risks of foreign investing are generally magnified in the smaller and more volatile securities markets of the developing world.
Growth Fund: The smaller and less seasoned companies that may be in the Growth Fund have a greater risk of price volatility.
Participation Fund: While the Participation Fund does not invest in conventional bonds, risks similar to those of conventional nondiversified fixed-income funds apply. These include: diversification and concentration risk, liquidity risk, interest rate risk, credit risk, and high-yield risk. The Participation Fund also includes risks specific to investments in Islamic fixed-income instruments. The structural complexity of sukuk, along with the weak infrastructure of the sukuk market, increases risk. Compared to rights of conventional bondholders, holders of sukuk may have limited ability to pursue legal recourse to enforce the terms of the sukuk or to restructure the sukuk in order to seek recovery of principal. Sukuk are also subject to the risk that some Islamic scholars may deem certain sukuk as not meeting Islamic investment principles subsequent to the sukuk being issued.
Morningstar Ratings™ A
As of December 31, 2024
| 1 Year | 3 Year | 5 Year | 10 Year | 15 Year | Overall |
|---|---|---|---|---|---|---|
Amana Income Fund – “Large Blend” Category | ||||||
Investor Shares (AMANX) | n/a | ★★ | ★★★ | ★★ | n/a | ★★★ |
% Rank in Category | 91 | 78 | 88 | 91 | 95 | n/a |
Institutional Shares (AMINX) | n/a | ★★ | ★★★ | ★★ | n/a | ★★ |
% Rank in Category | 90 | 76 | 86 | 89 | 93 | n/a |
Number of Funds in Category | 1,386 | 1,280 | 1,180 | 889 | 704 | 1,280 |
Amana Growth Fund – “Large Growth” Category | ||||||
Investor Shares (AMAGX) | n/a | ★★★ | ★★★ | ★★★★ | n/a | ★★★★ |
% Rank in Category | 93 | 73 | 53 | 46 | 66 | n/a |
Institutional Shares (AMIGX) | n/a | ★★★ | ★★★★ | ★★★★ | n/a | ★★★★ |
% Rank in Category | 92 | 71 | 49 | 38 | 61 | n/a |
Number of Funds in Category | 1,088 | 1,020 | 952 | 748 | 587 | 1,020 |
Amana Developing World Fund – “Diversified Emerging Markets” Category | ||||||
Investor Shares (AMDWX) | n/a | ★★★★ | ★★★★★ | ★★★ | n/a | ★★★★ |
% Rank in Category | 43 | 32 | 15 | 69 | n/a | n/a |
Institutional Shares (AMIDX) | n/a | ★★★★ | ★★★★★ | ★★★★ | n/a | ★★★★ |
% Rank in Category | 39 | 29 | 13 | 62 | n/a | n/a |
Number of Funds in Category | 787 | 707 | 632 | 430 | 219 | 707 |
Amana Participation Fund – “Emerging Markets Bond” Category | ||||||
Investor Shares (AMAPX) | n/a | ★★★★ | ★★★★ | n/a | n/a | ★★★★ |
% Rank in Category | 17 | 21 | 14 | n/a | n/a | n/a |
Institutional Shares (AMIPX) | n/a | ★★★★ | ★★★★ | n/a | n/a | ★★★★ |
% Rank in Category | 12 | 20 | 11 | n/a | n/a | n/a |
Number of Funds in Category | 165 | 164 | 152 | n/a | n/a | 164 |
© 2025 Morningstar®. All rights reserved. Morningstar, Inc. is an independent fund performance monitor. The information contained herein: (1) is proprietary to Morningstar and/or its content providers; (2) may not be copied or distributed; and (3) is not warranted to be accurate, complete, or timely. Neither Morningstar nor its content providers are responsible for any damages or losses arising from any use of this information.
A Morningstar Ratings™ ("Star Ratings") are as of December 31, 2024. The Morningstar Rating™ for funds, or "star rating", is calculated for managed products (including mutual funds, variable annuity and variable life subaccounts, exchange-traded funds, closed-end funds, and separate accounts) with at least a three-year history. Exchange-traded funds and open-ended mutual funds are considered a single population for comparative purposes. It is calculated based on a Morningstar Risk-Adjusted Return measure that accounts for variation in a managed product's monthly excess performance (not including the effects of sales charges, loads, and redemption fees), placing more emphasis on downward variations and rewarding consistent performance. The top 10% of products in each product category receive 5 stars, the next 22.5% receive 4 stars, the next 35% receive 3 stars, the next 22.5% receive 2 stars, and the bottom 10% receive 1 star. The Overall Morningstar Rating for a managed product is derived from a weighted average of the performance figures associated with its three-, five-, and 10-year (if applicable) Morningstar Rating metrics. The weights are: 100% three-year rating for 36-59 months of total returns, 60% five-year rating/40% three-year rating for 60-119 months of total returns, and 50% 10-year rating/30% five-year rating/20% three-year rating for 120 or more months of total returns. While the 10-year overall star rating formula seems to give the most weight to the 10-year period, the most recent three-year period actually has the greatest impact because it is included in all three rating periods.
% Rank in Category is the fund’s percentile rank for the specified time period relative to all funds that have the same Morningstar category. The highest (or most favorable) percentile rank is 1 and the lowest (or least favorable) percentile rank is 100. The top-performing fund in a category will always receive a rank of 1. Percentile ranks within categories are most useful in those categories that have a large number of funds.
The Amana Mutual Funds offer two share classes – Investor Shares and Institutional Shares, each of which has different expense structures.