Amana Funds Quarterly Commentary - Q1 2025
Key Market Takeaways
- US Equity Underperformance in Q1 2025 – After two years of strong performance, US equities saw their largest quarterly decline since 2022, with the S&P 500 Index falling 4.27% in Q1 2025. An equal-weighted S&P 500 index underperformed further, declining 0.67%, highlighting weaker market breadth as large-cap companies drove prior gains.
- International Equities Outperform – In contrast to US markets, international equities performed strongly in Q1 2025. The MSCI EAFE Index (focused on developed markets like Europe and Japan) returned 7.01%, while the MSCI Emerging Markets Index gained 3.01%, marking a reversal of recent underperformance.
- Drivers of Market Trends – Global equity markets have been driven by three key themes since their 2022 lows: US economic exceptionalism, advancements in artificial intelligence (AI), and resilient economies. However, cracks emerged in Q1 2025, particularly in the US, as market dynamics shifted amidst broader economic challenges.
Since their 2022 nadir, global equity markets generated strong returns on the back of three main themes: 1. US economic exceptionalism, 2. AI, and 3. resilient economies. Given that triad, and the concentration of AI enablers in the US, it’s unsurprising that domestic equities outperformed their global peers. After two impressive years, cracks emerged in that three-legged stool this quarter, resulting in domestic equity underperformance.
In the first quarter of 2025, US equities posted their largest quarterly decline since 2022, with the S&P 500 Index down 4.27%. Last year, great performance from a few very large companies propelled the index. This quarter, those same companies dragged the index lower as market breadth improved. Demonstrating this dynamic, an equal-weighted S&P 500 returned -0.67%, clearly outperforming its market capitalization-weighted counterpart.
Concurrently, International Developed and Emerging Market equities outperformed in the three months ended March 31, 2025, bucking their recent underperformance. The MSCI EAFE Index, predominantly comprising developed Europe and Japan, returned 7.01%, while the MSCI Emerging Markets Index gained 3.01%.
| Total return | 2022 | 2023 | 2024 | 2025 (Q1) |
| S&P 500 Index | -18.2% | 26.3% | 25.0% | -4.3% |
| S&P 500 Equal-Weight Index | -11.6% | 13.7% | 12.8% | -0.7% |
| MSCI EAFE Index | -14.0% | 18.8% | 7.5% | 7.0% |
| MSCI Emerging Markets Index | -20.1% | 9.8% | 4.4% | 3.0% |
Outlook
US Economic Exceptionalism
The US economy has long been the envy of the developed world courtesy of a superior demographic profile, favorable geography, energy independence, and access to differentiated manufacturing hubs to the north and south. Take these structural factors and add a thriving entrepreneurial culture, deep capital markets, and robust property rights. The resulting milieu is a positive environment for wealth creation. Whether due to America’s twin deficits or attracted by the prospect of superior investment returns, record sums of global capital flowed into the US.
The return of President Donald Trump to Washington augurs accelerating isolationist policies and the desire to downsize government. We know the administration’s strategy is to increase domestic manufacturing and tariffs are the preferred tactic. The administration announced at least 13 different tariff policies over the past two months, culminating with shock and awe rates levied at global trade partners on April 2. While the announcements are intended to elicit fear and outrage, expect the shape of tariffs to continue shifting with what promises to be lengthy negotiations and myriad carveouts.
US companies benefitted greatly from the global status quo their country empowered. A credible desire to remake that status quo breeds uncertainty as beneficiaries of the preceding decades may cede their advantages. Despite policy noise, most structural factors supporting the US remain in place.
Artificial Intelligence
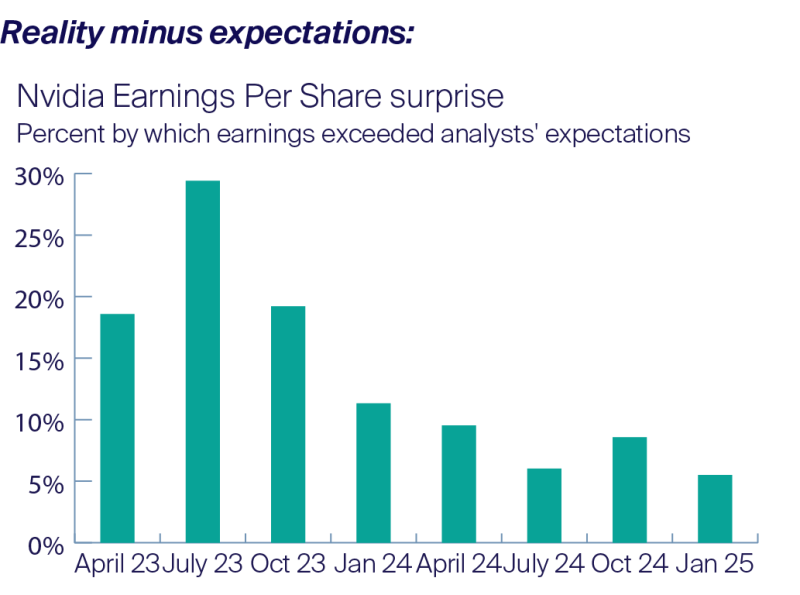
Companies across the AI value chain performed well in 2024. No company is more synonymous with AI than Nvidia, whose chips are used to both train AI models and provide their output (inference). Nvidia’s data center sales more than doubled to $115 billion in their most recent fiscal year as manufacturing capacity at Taiwan Semiconductor, rather than demand, was the limiting factor.
The AI trade is running up against a fundamental law governing markets and humans. Reality relative to expectations is more important than absolute reality, specifically in the short-term. Eventually expectations catch up to reality, which is where we are now. As the world’s most heavily scrutinized company, the market has a very good idea of Nvidia’s sales this year. Instead, the focus is on next year, as assumptions telescope on future data center spending. The purchase intentions of large cloud service providers and so-called hyperscalers (Alphabet, Microsoft, Google, Amazon, and Meta) will be carefully inspected for clues. Consternation over a possible spending slowdown have the market on edge as crowded trades exacerbate volatility.
Over the weekend of January 25 and 26, a new AI model from DeepSeek circulated among US investors and the financial press. Training the competitive model, called R1, was ostensibly far less expensive than those of the large US AI labs, threatening the more-is-more spending narrative. This concern caused a sharp selloff in AI-exposed companies, with shares of many down double digits. DeepSeek pioneered novel methods of running models more efficiently. However, this process of “reasoning” — where the model iterates to provide an optimal output — remains more compute-intensive than the previous standard.
We are in the early days of AI as capabilities and products are constantly improving. Intellectual humility is crucial. Much like envisaging the internet in the 1960s, it’s possible that we cannot even imagine what the end products and possible use cases will be. Regardless of our ability to predict the future, AI’s potential is clear and wide-ranging, illustrated by rapid adoption among individuals and businesses alike. Most hard data we’re seeing points to continued buildout of AI infrastructure.
Resilient Economies
Since 2022, global economies by and large defied expectations that a global interest rate hiking cycle — meant to combat inflation — would cause a recession. Equity markets continually climbed a wall of worry on the back of strong household consumption, government spending, and business investment. Finally, recessionary risks appeared in the rearview during late 2024 as central banks across the developed world, confident they had inflation under control, began reducing interest rates. Purportedly, the US economy was firing on all cylinders.
The new administrative regime brings policy uncertainties that call US exceptionalism into question, while simultaneously threatening global economies. A decline in US government spending would be a drag on growth, and fewer federal jobs mean higher unemployment and less household spending — America’s most important growth driver — all else equal. Faced with unclear future trade policies, businesses are postponing investment. US imports rose dramatically in the first quarter to front-run tariffs, a dynamic that will add noise to gross domestic product figures. Rising trade barriers would adversely impact economies the world over that depend on exports to the US. Tariffs and deportations come with added inflationary risks domestically and uncertain price impacts abroad. Working out economic outcomes is at best difficult when you know the policies. It’s near impossible when you’re left to assume.
The answer, as always, comes back to the health of the US consumer. So far, the labor market remains healthy with minimal signs of strain.
While we see the underlying sources of strength for each of these themes persisting, considerable uncertainty exists in the short-term. The intertwined complexity of economies means that a breakdown in one theme threatens the others. We believe that diversification and a clear mind are the most powerful antidotes to such periods of volatility.
Amana Income Fund
In the first quarter of 2025, Amana Income Fund Investor shares returned -1.31% and the Institutional shares returned -1.25%. The S&P 500 Index returned -4.27% over the same period.
After a promising start to the year, markets turned south in the second half of the quarter as concern amplified over an aggressive rollout of trade and tariff actions from President Trump. International equities outperformed US equities. Additionally, there continues to be a high level of uncertainty about the extent to which trade actions are intended to be temporary as an opening salvo for negotiating better trade deals, or a more permanent method to restructure the orientation of the US economy and bring in more tariff revenue. If the latter, it will take time for the global economy to re-orient itself to the new reality.
Either way, trust in the US is coming into question and creates a challenging environment for longer-term capital investment planning. It’s important to remember that the US markets have gone up double digit for two straight years while international markets have lagged. This might explain, to an extent, the fact that international equities outperformed US equities.
Health Care sector stocks led the Fund’s performance in the quarter, with Amgen, AbbVie, and Abbot Laboratories helping to limit the Fund’s downside and outperform the broader equity market.
The Fund’s biggest detractors were semiconductor and AI-related companies Broadcom and Taiwan Semiconductor due to concerns about their exposure to possible tariffs on imports and over-investment in the technology.
Outlook
With heightened uncertainty about global trade relations and the potential impact on supply chains and investments, we believe dividends provide a source of “returns” that can be earned now, rather than hoped for in the longer-term future. We also hope the Amana Income Fund’s emphasis on companies with low debt, quality operations, and dividend income provides a prudent way for investors to ride out the uncertainty.
As of March 31, 2025
| 10 Largest Contributors | Return | Contribution |
| Eli Lilly | 7.17% | 0.86 |
| Abbott Laboratories | 17.90% | 0.38 |
| Amgen | 20.51% | 0.38 |
| Nintendo | 15.55% | 0.37 |
| Linde | 11.59% | 0.35 |
| Novartis, ADR | 18.64% | 0.29 |
| Kenvue | 13.42% | 0.26 |
| Johnson & Johnson | 15.59% | 0.20 |
| Kimberly Clark | 9.48% | 0.20 |
| AbbVie | 19.04% | 0.18 |
| 10 Largest Detractors | Return | Contribution |
| Taiwan Semiconductor, ADR | -15.61% | -1.37 |
| Broadcom | -27.56% | -1.05 |
| Microsoft | -10.76% | -1.00 |
| Rockwell Automation | -9.20% | -0.44 |
| Eaton | -17.78% | -0.35 |
| W.W. Grainger | -6.10% | -0.28 |
| United Parcel Service, Class B | -11.54% | -0.21 |
| Ferguson Enterprises | -7.21% | -0.14 |
| PPG Industries | -5.74% | -0.12 |
| Texas Instrument | -3.46% | -0.09 |
| Top 10 Holdings | Portfolio Weight |
| Apple | 8.78% |
| Microsoft | 5.00% |
| Eli Lilly | 4.91% |
| Nvidia | 4.59% |
| Alphabet, Class A | 4.19% |
| ASML Holding NY | 4.12% |
| Taiwan Semiconductor, ADS | 4.05% |
| Broadcom | 3.88% |
| Intuit | 3.54% |
| Johnson Controls | 3.23% |
Amana Growth Fund
The Amana Growth Fund Investor shares shed 8.29% in the first quarter of 2025, dragged lower by a reversal in technology shares following two years of exuberance. Concurrently, the Amana Growth Fund Institutional shares shed 8.25%. Over the same period the S&P 500 Index slipped 4.27%. The gap in performance resulted from a heavier exposure to poorly performing technology stocks and the absence of energy investments — the best performing sector during the quarter.
Relative to the more technology-focused NASDAQ Composite Index, which dropped 10.26% during the quarter, the Fund relative performance was better. The key development of the first quarter was the reversal in performance of the mega-cap Magnificent Seven and the broadening of returns to other sectors, such that the equal weight S&P 500 ETF (ticker: RSP) significantly outperformed the standard market capitalization weighted benchmark.
Nothing demonstrates the first quarter reversal of fortunes more than the top contributors and detractors to Fund returns. While several of the contributors listed above performed well in 2024, including Cisco, Johnson Controls, Autozone, and Lilly, most of the others were subdued. Meanwhile, the complete absence of the mega-cap technology stocks astounds.
We are broadly positive on the outlook for all of the top contributors, although the April 2 tariff announcement creates complications. For example, Union Pacific could be exposed to a reduction in container traffic. Drug firms such as Lilly and AbbVie often import active pharmaceutical ingredients and many come from China. Autozone’s parts sales could be subject to levies on imports from Mexico and Canada. Regardless, tariffs are across the board and, post the April 2 announcement, it appears likely that retaliatory measures will be enacted. There are few places to hide.
The turnaround in technology performance truly was stunning, as we see all but one of the top detractors hailing from that sector. Only pharmaceutical firm Novo Nordisk represents a different industry. Perhaps most telling, seven of the top detractors were included among the top contributors for 2024. We believe that AI, which initially sparked the tech-driven rally following Nvidia’s May 2023 earnings announcement, will remain a legitimate secular driver of economic activity for years to come.
We are, however, at that point in the cycle where vast sums of money have been invested but the economic payoff has yet to become clear. Cognizant of past land grabs in optic fiber cables and the internet, or even automobiles and the radio if you care to reach back further, investors are waiting for a clearer picture of how AI will be monetized, and which companies are best placed to succeed. At the same time, valuations had become stretched, and companies were coming off a two-year bull run. We should not be surprised by the market taking a breather, especially given the uncertainties surrounding national economic policies.
It’s a bit surprising there wasn’t greater turnover among the top positions but as it turned out, ServiceNow was the only stock to depart the top ten, being replaced by Johnson Controls, which appreciated slightly during the quarter, compared to NOW’s significant sell-off.
As of March 31, 2025
| 10 Largest Contributors | Return | Contribution |
| AutoZone | 19.07% | 0.46 |
| AbbVie | 19.04% | 0.35 |
| Eli Lilly | 7.17% | 0.28 |
| AstraZeneca ADR | 13.77% | 0.25 |
| Church And Dwight | 5.43% | 0.12 |
| Stryker | 3.62% | 0.07 |
| Union Pacific | 4.16% | 0.05 |
| Johnson Controls | 1.94% | 0.05 |
| Cisco Systems | 4.95% | 0.05 |
| Procter & Gamble | 2.28% | 0.04 |
| 10 Largest Detractors | Return | Contribution |
| Broadcom | -27.56% | -1.37 |
| Apple | -11.20% | -1.06 |
| Nvidia | -19.29% | -1.01 |
| ServiceNow | -24.90% | -0.91 |
| Alphabet, Class A | -18.21% | -0.88 |
| Taiwan Semiconductor, ADR | -15.61% | -0.70 |
| Novo-Nordisk, ADR | -18.00% | -0.62 |
| Microsoft | -10.76% | -0.56 |
| Oracle | -15.88% | -0.46 |
| Adobe | -13.75% | -0.39 |
| Top 10 Holdings | Portfolio Weight |
| Apple | 8.78% |
| Microsoft | 5.00% |
| Eli Lilly | 4.91% |
| Nvidia | 4.59% |
| Alphabet, Class A | 4.19% |
| ASML Holding NY | 4.12% |
| Taiwan Semiconductor, ADS | 4.05% |
| Broadcom | 3.88% |
| Intuit | 3.54% |
| Johnson Controls | 3.23% |
Amana Developing World Fund
Amana Developing World Fund Investor shares total return was -4.44% for the first quarter of 2025, underperforming the MSCI Emerging Markets (EM) Index, which was up 3.01%. The Institutional shares of the fund returned -4.35 over the same period. The Fund’s Morningstar peer group was up 1.77% in the quarter.
For several years the fund has been underweight China, largely on governance concerns. While this worked to the Fund’s benefit in 2023 and 2024, Chinese stocks saw a sharp rise in the first quarter, with the MSCI China Index up 15.10% in the quarter. The Amana Developing World Fund Institutional Shares continues to receive four-stars for its overall performance from Morningstar.
A host of industries including Materials, Utilities, Technology, Consumer Staples, and Health Care were represented among the top contributors. The contributors are illustrative of the Fund’s approach to balance technological driven growth with real economy growth and inflation protection. For instance, Barrick Gold, the Fund’s top contributor during the quarter, provides a hedge against both inflation and concerns around de-dollarization. Manila Electric, on the other hand, provides defensive exposure to increasing electric demand amid the Philippines’ continued industrialization.
The Fund’s largest detractors were dominated by tech stocks. During the first quarter of 2025, six of the 10 largest detractors were from the Technology sector. Nivida was the largest detractor, with shares selling off amid concerns that AI compute could be done more efficiently. Shares began to slide after Chinese AI startup Deepseek suggested it could build AI models at a fraction of the cost being employed by Western firms and using less-advanced Nvidia chips.1 While Deepseek is likely a meaningful innovation in AI-model development, large US tech firms have doubled down on their expected AI investments. We expect Nvidia will remain at the forefront of the AI revolution.
During the quarter, the Fund sold KCE Electronics. The Thai company is one of the world’s top 10 automotive printed circuit board manufacturers and has suffered from the headwinds facing European auto manufacturers. The automotive sector remains in the doldrums, and the threat of tariff wars undermined our confidence that this stock would turn around after a challenging cycle.
Among the many questions facing emergining market investors, such as dedollarization and the fallout from global trade wars, is whether China is investible stands out. While recent developments such as Jack Ma’s return to prominence and signals of renewed government support for private enterprise suggest a more business-friendly environment, we remain cautious about whether these changes reflect a structural shift in governance or merely short-term measures to stabilize the economy. Despite attractive valuations across Chinese equities and growing opportunities in sectors like AI, e-commerce, and high-end manufacturing, we believe it is crucial to prioritize investments in high-quality companies where shareholder interests are respected. As we evaluate whether and how to increase exposure to China, our focus will remain on identifying firms with robust fundamentals and governance practices in locations where owners interests are protected.
1 Kachwala, Zaheer and Aditya Soni. DeepSeek's low-cost AI spotlights billions spent by US tech. Reuters. January 29, 2025. https://www.1reuters.1com/technology/artificial-intelligence/big-tech-faces-heat-chinas, -deepseek-sows-doubts-billion-dollar-spending-2025-01-27/
As of March 31, 2025
| 10 Largest Contributors | Return | Contribution |
| Barrick Gold | 26.13% | 0.54 |
| Manila Electric | 17.15% | 0.52 |
| Saudi Telecom | 14.97% | 0.39 |
| Kimberly-Clark de Mexico, Class A | 15.98% | 0.29 |
| KPJ Healthcare | 10.78% | 0.23 |
| Unilever, ADR | 5.89% | 0.18 |
| Samsung Electronics | 9.37% | 0.16 |
| Advantech | 6.86% | 0.14 |
| Ford Otomotiv Sanayi A | 5.28% | 0.14 |
| Sociedad Quimica y Minera de Chile, ADR | 9.27% | 0.13 |
| 10 Largest Detractors | Return | Contribution |
| Nvidia | -19.29% | -2.01 |
| Hartalega Holdings | -51.79% | -1.02 |
| Taiwan Semiconductor Manufacturing, ADR | -15.61% | -0.68 |
| BIM Birlesik Magazalar A | -19.23% | -0.63 |
| Delta Electronics | -17.43% | -0.60 |
| Wilcon Depot | -50.45% | -0.56 |
| Infosys, ADR | -16.74% | -0.50 |
| KCE Electronics | -33.49% | -0.34 |
| Samsung SDI | -23.52% | -0.27 |
| WEG | -6.70% | -0.22 |
| Top 10 Holdings | Portfolio Weight |
| Nvidia | 8.04% |
| Taiwan Semiconductor, ADS | 3.54% |
| Manila Electric | 3.23% |
| UltraTech Cement | 3.06% |
| Jabil Inc | 3.05% |
| Unilever ADS | 3.04% |
| Qualcomm | 2.95% |
| Colgate-Palmolive | 2.94% |
| Southern Copper | 2.87% |
| Saudi Telecom | 2.85% |
Amana Participation Fund
The adage, “March comes in like a lion and goes out like a lamb,” has found a striking parallel in global financial markets during the first quarter of 2025, where extraordinary volatility has given way to cautious stability. January roared onto the scene with tumultuous market conditions — identified by sharp currency fluctuations, equity markets rolling, commodity price swings, and global bond markets ebbing.
However, as March progressed, we’ve witnessed a gradual calming of these turbulent conditions, with inflation pressures easing and institutional investors returning to riskier assets, suggesting that first-quarter market turbulence may indeed be yielding to more lamb-like conditions as we move into the second quarter of the year. We note all this while being cognitive of the announcements surrounding tariffs. As such, we’re retaining a cautious stance.
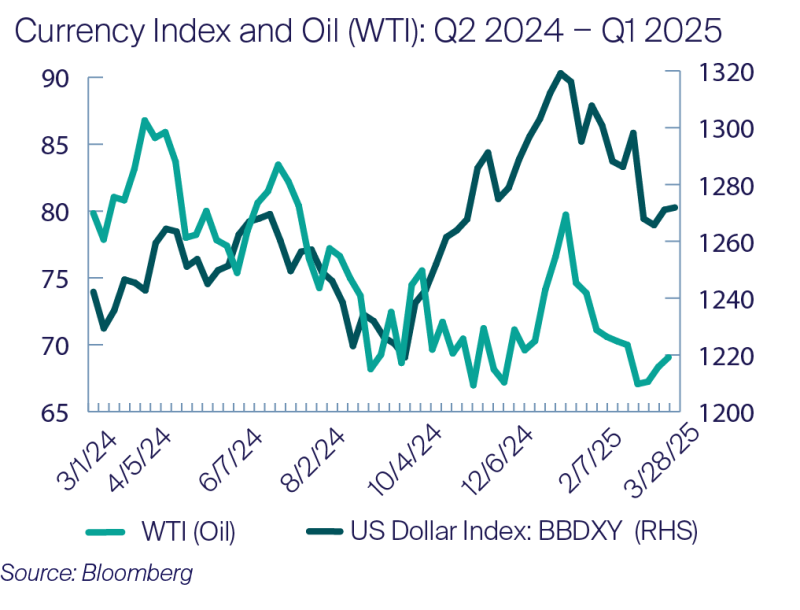
The first quarter of 2025’s market volatility can be observed in the accompanying illustrations. The first graph shows the US dollar index (BBDXY) alongside the price of crude, as measured by West Texas Intermediate (WTI) contracts.1 As illustrated, BBDXY rose from a low of 1,219.14 at the end of the third quarter to an intra-quarter high of 1319.11 on January 10, 2025, reflecting a 7.96% increase. This upward trend then later reversed with the dollar index falling 3.58% at the end of the first quarter to 1,271.87. WTI in contrast, has fallen 13.38% from its first quarter apex of $79.72 on January 17, 2025, to $69.05 on at the end of the first quarter, reflecting a 13.38% decline. Such large moves among widely held financial instruments is uncommon. Typical pronounced movements reflect tactical adjustments made by investors to fine tune exposures in light of the current reshaping of a dynamic geopolitical landscape.
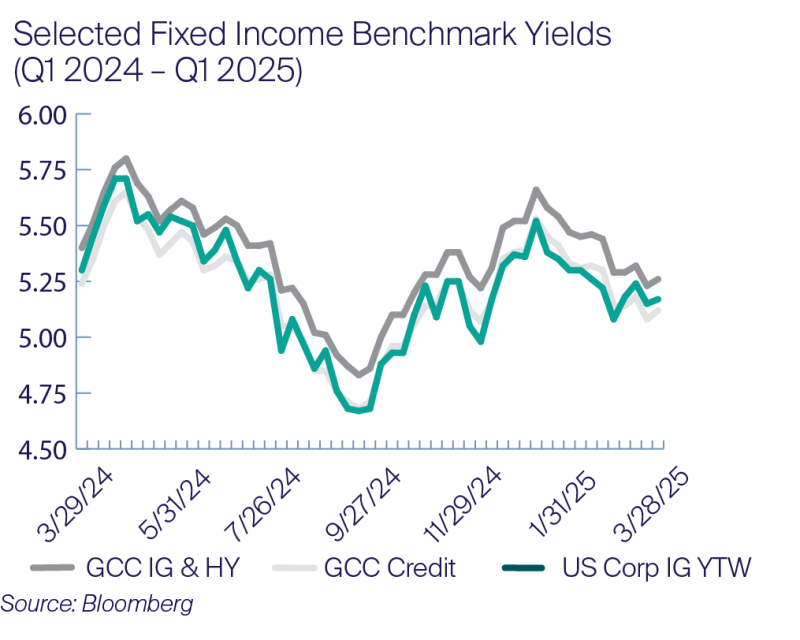
Fixed income securities also ebbed during this bout of market volatility. As observed in the accompanying illustration, yields of three different fixed income benchmarks have experience volatility. This illustration includes a benchmark of US domestic investment grade issuers (US Corp IG), investment grade issuers from the Gulf Cooperative Council (GCC) referred to as GCC Credit, and GCC investment grade (IG) and high yield (HY) issuers identified as GCC IG & HY. All surged from lows at the end of the third quarter to later fall at the close of the first quarter.
Notably, all three benchmarks reversed course at the start of the third quarter of 2024, rising to account for the risk premium brought on by growing fears about the probability of a recession. What stands out to the careful observer is the GCC Credit benchmark (shown in red), is that investment grade issuers domiciled in the GCC now trade at with a lower yield profile to US corporate IG issuers, reflecting, in part, investors’ confidence in the region relative to US issuers. This speaks to the resiliency of the GCC and broadly speaking bodes well for sukuk holders as it implies investors require less of a risk premium as a form of compensation for risk, expressed as a yield, relative to US IG issuers.
We will continue to keep careful attention on the development of these markets.
Amana Participation Fund — First Quarter Results
At the end of the first quarter of 2025, the Amana Participation Fund Institutional shares and Amana Participation Fund Investor shares posted a quarterly return of 1.74% and 1.69%, respectively. This is compared to the FTSE Sukuk Index, which returned 2.27% for the same period. Over the trailing 12-months, Amana Participation Fund Institutional shares retuned 5.22% and Amana Participation Fund Investor shares returned 4.98%. This is compared to the FTSE Sukuk Index, which returned 5.73% for the same period.
The Amana Participation Fund’s underperformance can be attributed, in part, to differences in the composition of the benchmark relative to the Fund. Details of these differences can be found in previous quarterly report and in the white paper titled, “Behind the Scenes: A Closer Look at the Amana Participation Fund Investment Process.”
At end of the first quarter of 2025, the Institutional Fund shares provided a SEC 30-day yield of 2.85% with the Investor shares offering a SEC 30-day yield of 2.62%. The Amana Participation Fund reported an effective duration of 3.43 years. The Fund is diversified among 58 securities, excluding cash, which include Islamic placements such as murabaha to meet its investment objective of capital preservation and current income while being entirely invested in US dollar-denominated securities.
The top two performing issues during the first quarter of 2025 were the Saudi Electric Company and Malaysian telecom operator Axiata, posting a return of 3.84% and 3.45%, respectively. For the same period, the two worst-performing issues were Dubai-based real estate operator Emirates REIT and air leasing company AerCap, with the two returning -0.33% and 0.31%, respectively.
1 The Bloomberg Dollar Spot Index tracks the performance of a basket of ten leading global currencies versus the U.S. Dollar. As of March 31, 2025, the weightings of the index include Eurodollar 29.28%, followed by the Japanese Yen (JPY) at 12.61%, Canadian dollar (CAD) at 11.54%, British pound (GBP) at 10.19% and the Mexican peso (MXN) at 9.41%.
As of March 31, 2025
| Top 10 Holdings | Portfolio Weight |
| KFH Tier 1 Sukuk | 4.32% |
| Dar Al-Arkan Sukuk | 3.26% |
| DP World Salaam | 3.04% |
| DAE Sukuk | 2.97% |
| SA Global Sukuk | 2.96% |
| EMAAR Sukuk | 2.91% |
| TNB Global Ventures | 2.83% |
| Alpha Star Holding | 2.81% |
| Air Lease Corp Sukuk | 2.73% |
| TNB Global Ventures Cap | 2.68% |
Performance Summary
As of March 31, 2025
| Average Annual Total Returns (before taxes, net of fees) | YTD | 1 Year | 3 Year | 5 Year | 10 Year | 15 Year | Expense Ratio1 |
| Income Fund Investor Shares (AMANX) | -1.31% | 1.25% | 7.24% | 14.47% | 9.50% | 10.18% | 1.01% |
| Income Fund Institutional Shares (AMINX) | -1.25% | 1.52% | 7.50% | 14.74% | 9.76% | n/a | 0.76% |
| S&P 500 Total Return | -4.27% | 8.25% | 9.06% | 18.59% | 12.50% | 13.15% | n/a |
| Morningstar "Large Blend" Category | -3.76% | 5.76% | 7.82% | 17.26% | 10.99% | 11.87% | n/a |
| Growth Fund Investor Shares (AMAGX) | -8.29% | -4.02% | 6.31% | 16.82% | 13.30% | 12.67% | 0.87% |
| Growth Fund Institutional Shares (AMIGX) | -8.25% | -3.80% | 6.56% | 17.10% | 13.56% | n/a | 0.62% |
| S&P 500 Total Return | -4.27% | 8.25% | 9.06% | 18.59% | 12.50% | 13.15% | n/a |
| Morningstar "Large Growth" Category | -8.49% | 5.01% | 7.76% | 16.99% | 12.61% | 13.13% | n/a |
| Developing World Fund Investor Shares (AMDWX) | -4.44% | -2.78% | 1.44% | 8.51% | 2.76% | 1.84% | 1.20% |
| Developing World Fund Institutional Shares (AMIDX) | -4.35% | -2.57% | 1.66% | 8.75% | 2.96% | n/a | 0.98% |
| MSCI Emerging Markets Index | 3.01% | 8.65% | 1.91% | 8.38% | 4.11% | 3.43% | n/a |
| Morningstar "Diversified Emerging Markets" Category | 1.77% | 4.96% | 1.72% | 8.84% | 3.59% | 3.08% | n/a |
| Participation Fund Investor Shares (AMAPX) | 1.69% | 4.98% | 1.89% | 2.39% | n/a | n/a | 0.83% |
| Participation Fund Institutional Shares (AMIPX) | 1.74% | 5.22% | 2.10% | 2.64% | n/a | n/a | 0.58% |
| FTSE IdealRatings Sukuk Index | 2.27% | 5.70% | 2.27% | 3.11% | 3.10% | 3.91% | n/a |
| Morningstar "Emerging Markets Bond" Category | 2.43% | 7.16% | 4.12% | 4.66% | 3.11% | 3.68% | n/a |
Performance data quoted represents past performance, is before any taxes payable by shareowners, and is no guarantee of future results. Current performance may be higher or lower than that stated herein. Performance current to the most recent month-end is available by calling toll-free 1-800-728-8762 or visiting www.amanafunds.com. Average annual total returns are historical and include change in share value as well as reinvestment of dividends and capital gains, if any. The investment return and principal value of an investment will fluctuate so that an investor’s shares, when redeemed, may be worth more or less than their original cost. Shares of a Fund may only be offered for sale through the Fund’s prospectus or summary prospectus.
1 Expense ratios shown are as stated in the Funds’ most recent Prospectus dated September 27, 2024.
The S&P 500 is an index comprised of 500 widely held common stocks considered to be representative of the US stock market in general. The S&P 500 Equal Weight Index (EWI) is the equal-weight version of the widely-used S&P 500. The index includes the same constituents as the capitalization weighted S&P 500, but each company in the S&P 500 EWI is allocated a fixed weight - or 0.2% of the index total at each quarterly rebalance.
The MSCI Emerging Markets Index, produced by Morgan Stanley Capital International, measures equity market performance in over 20 emerging market countries. The FTSE IdealRatings Sukuk Index measures the performance of global Islamic fixed-income securities, also known as sukuk. When available, Saturna uses total return components of indices mentioned. Investors cannot invest directly in the indices.
Institutional Shares of the Amana Funds began operations September 25, 2013. The Amana Participation Fund began operations September 28, 2015.
Income, Growth, Developing World, and Participation Funds: The value of the shares of each of the Funds rises and falls as the value of the securities in which the Funds invest goes up and down. The Amana Mutual Funds limit the securities they purchase to those consistent with Islamic principles. This limits opportunities and may affect performance. Each of the Funds may invest in securities that are not traded in the United States. Investments in the securities of foreign issuers may involve risks in addition to those normally associated with investments in the securities of US issuers. These risks include currency and market fluctuations and political or social instability. The risks of foreign investing are generally magnified in the smaller and more volatile securities markets of the developing world.
Growth Fund: The smaller and less seasoned companies that may be in the Growth Fund have a greater risk of price volatility.
Participation Fund: While the Participation Fund does not invest in conventional bonds, risks similar to those of conventional nondiversified fixed-income funds apply. These include: diversification and concentration risk, liquidity risk, interest rate risk, credit risk, and high-yield risk. The Participation Fund also includes risks specific to investments in Islamic fixed-income instruments. The structural complexity of sukuk, along with the weak infrastructure of the sukuk market, increases risk. Compared to rights of conventional bondholders, holders of sukuk may have limited ability to pursue legal recourse to enforce the terms of the sukuk or to restructure the sukuk in order to seek recovery of principal. Sukuk are also subject to the risk that some Islamic scholars may deem certain sukuk as not meeting Islamic investment principles subsequent to the sukuk being issued.
Morningstar Ratings™ A
As of March 31, 2025
| 1 Year | 3 Year | 5 Year | 10 Year | 15 Year | Overall |
|---|---|---|---|---|---|---|
Amana Income Fund – “Large Blend” Category | ||||||
Investor Shares (AMANX) | n/a | ★★★ | ★★ | ★★ | n/a | ★★ |
% Rank in Category | 90 | 68 | 91 | 87 | 93 | n/a |
Institutional Shares (AMINX) | n/a | ★★★ | ★★ | ★★ | n/a | ★★ |
% Rank in Category | 88 | 63 | 89 | 84 | 90 | n/a |
Number of Funds in Category | 1,373 | 1,272 | 1,169 | 889 | 701 | 1,272 |
Amana Growth Fund – “Large Growth” Category | ||||||
Investor Shares (AMAGX) | n/a | ★★★ | ★★★ | ★★★★ | n/a | ★★★★ |
% Rank in Category | 98 | 75 | 55 | 35 | 65 | n/a |
Institutional Shares (AMIGX) | n/a | ★★★ | ★★★ | ★★★★ | n/a | ★★★★ |
% Rank in Category | 98 | 72 | 52 | 29 | 62 | n/a |
Number of Funds in Category | 1,079 | 1,027 | 949 | 745 | 582 | 1,027 |
Amana Developing World Fund – “Diversified Emerging Markets” Category | ||||||
Investor Shares (AMDWX) | n/a | ★★★ | ★★★ | ★★★ | n/a | ★★★ |
% Rank in Category | 91 | 55 | 53 | 76 | 89 | n/a |
Institutional Shares (AMIDX) | n/a | ★★★ | ★★★ | ★★★★ | n/a | ★★★★ |
% Rank in Category | 90 | 51 | 51 | 71 | 85 | n/a |
Number of Funds in Category | 777 | 714 | 636 | 435 | 216 | 714 |
Amana Participation Fund – “Emerging Markets Bond” Category | ||||||
Investor Shares (AMAPX) | n/a | ★★★★ | ★★★★ | n/a | n/a | ★★★★ |
% Rank in Category | 18 | 31 | 28 | n/a | n/a | n/a |
Institutional Shares (AMIPX) | n/a | ★★★★ | ★★★★ | n/a | n/a | ★★★★ |
% Rank in Category | 16 | 25 | 24 | n/a | n/a | n/a |
Number of Funds in Category | 159 | 158 | 151 | 123 | 82 | 158 |
© 2025 Morningstar®. All rights reserved. Morningstar, Inc. is an independent fund performance monitor. The information contained herein: (1) is proprietary to Morningstar and/or its content providers; (2) may not be copied or distributed; and (3) is not warranted to be accurate, complete, or timely. Neither Morningstar nor its content providers are responsible for any damages or losses arising from any use of this information.
A Morningstar Ratings™ (“Star Ratings”) are as of December 31, 2024. The Morningstar Rating™ for funds, or “star rating”, is calculated for managed products (including mutual funds, variable annuity and variable life subaccounts, exchange-traded funds, closed-end funds, and separate accounts) with at least a three-year history. Exchange-traded funds and open-ended mutual funds are considered a single population for comparative purposes. It is calculated based on a Morningstar Risk-Adjusted Return measure that accounts for variation in a managed product’s monthly excess performance (not including the effects of sales charges, loads, and redemption fees), placing more emphasis on downward variations and rewarding consistent performance. The top 10% of products in each product category receive 5 stars, the next 22.5% receive 4 stars, the next 35% receive 3 stars, the next 22.5% receive 2 stars, and the bottom 10% receive 1 star. The Overall Morningstar Rating for a managed product is derived from a weighted average of the performance figures associated with its three-, five-, and 10-year (if applicable) Morningstar Rating metrics. The weights are: 100% three-year rating for 36-59 months of total returns, 60% five-year rating/40% three-year rating for 60-119 months of total returns, and 50% 10-year rating/30% five-year rating/20% three-year rating for 120 or more months of total returns. While the 10-year overall star rating formula seems to give the most weight to the 10-year period, the most recent three-year period actually has the greatest impact because it is included in all three rating periods.
% Rank in Category is the fund’s total return percentile rank for the specified time period relative to all funds that have the same Morningstar category. The highest (or most favorable) percentile rank is 1 and the lowest (or least favorable) percentile rank is 100. The top-performing fund in a category will always receive a rank of 1. Percentile ranks within categories are most useful in those categories that have a large number of funds.
The Amana Mutual Funds offer two share classes – Investor Shares and Institutional Shares, each of which has different expense structures.